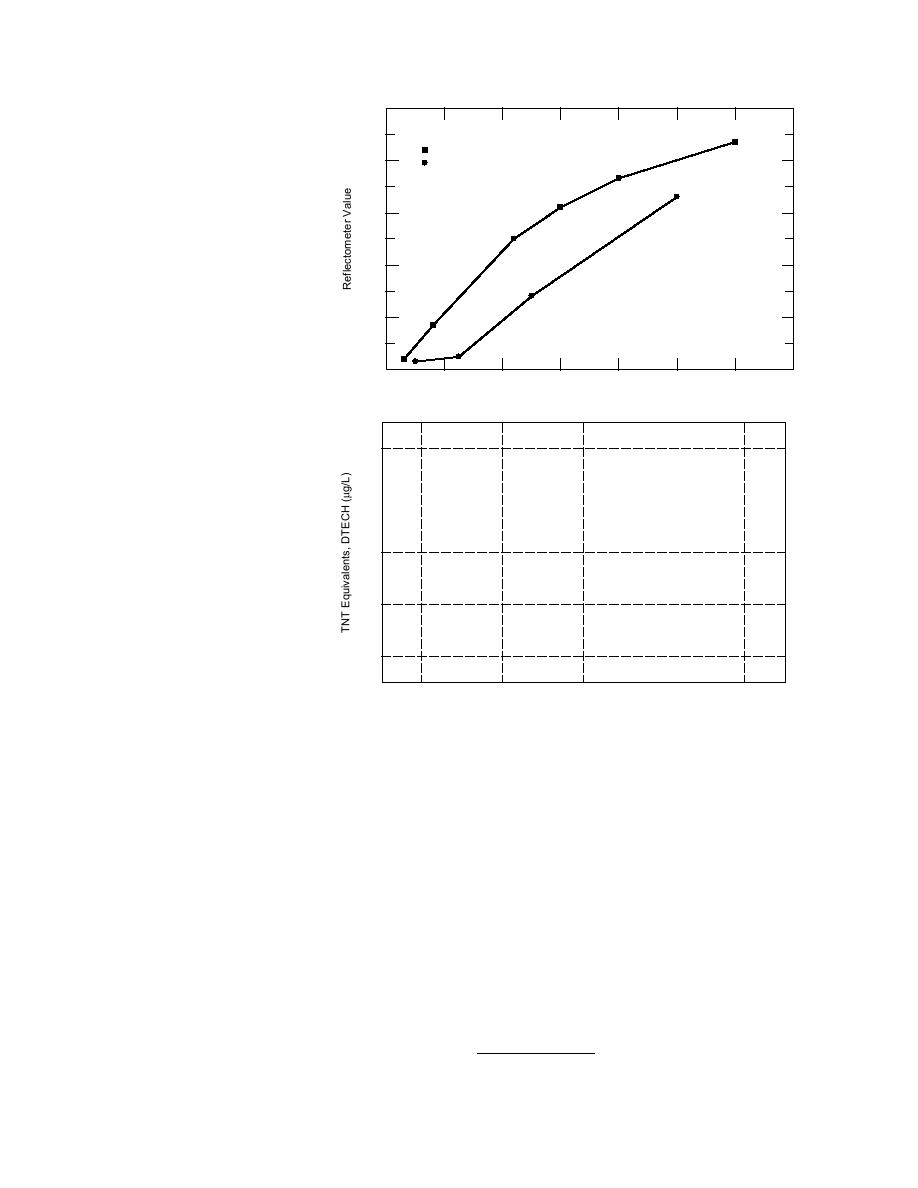
100
DTECH Standard
80
WES Standard
60
40
20
0
Figure 13. Standard curve produced at
0
10
20
30
40
50
60
70
WES vs. the DTECH published curve.
TNT (g/L)
50
2
40
2
1
30
20
1
1
0
1
10
12
0
Figure 14. RP-HPLC values vs.
20
0
DTECH values. Frequency of occur-
30
40
20
0
10
50
rence within each range.
TNT Equivalents, RP-HPLC (g/L)
The RDX kit performed so poorly that the man-
the extreme high values for wells 731 and 743
(Table 3). The RPD criterion had to be redefined; it
ufacturer was contacted for advice.* Other than a
was acceptable if the kit value and RP-HPLC val-
color development more rapid than anticipated,
ue fell within the same range. These kits failed
the kits passed the manufacturer's quality control
that test over half the time. The TNT kit produced
standards. Attempts to create a standard curve, as
the highest number of false positives--10 out of
was done for TNT, were unsuccessful.
33 wells. The question of false negatives can be
answered in two ways. The detection limit
SUMMARY AND CONCLUSIONS
claimed by the kit is 5 g/L, ten times higher than
the next most sensitive kit (EnviroGard). At this
The results of this investigation of 44 ground-
level no false negatives occurred. However, the
water wells were disappointing. None of the test
lack of false negatives is offset by the fact that the
kits performed as well as advertised. The quanti-
detection limit of 5 g/L is higher than the 2 g/L
tative assays were neither accurate nor precise
health advisory value proposed by the EPA for
enough to replace Method 8330 RP-HPLC deter-
drinking water (EPA 1989). The kit did fail to de-
minations, although they can be used adequately
tect TNT or its cross-reactive transformation
as screening tools. Of the two DTECH assays, the
products in nine samples that had measurable
RDX test failed badly by producing eight false
quantities by RP-HPLC. These kits might be con-
sidered when the detection limit is adequate and
* Personal communication, G.Teaney, Strategic Diagnostics,
the cost of false positives is low.
Newark, Del., 1994.
13


 Previous Page
