

5
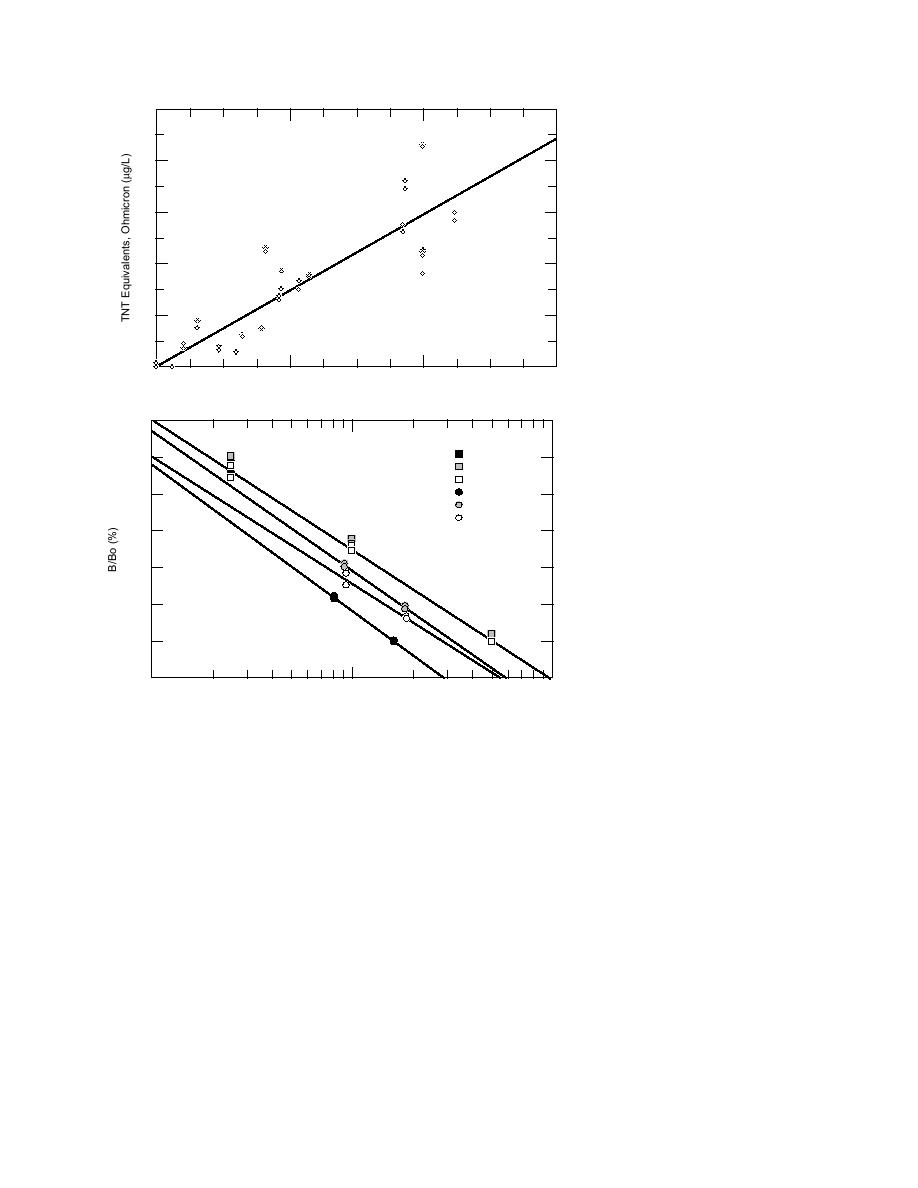
y = 0.00501 + 1.4757x
R2 = 0.867
4
3
2
1
0
Figure 11. RP-HPLC values vs. all
0
1
3
2
within-range Ohmicron values.
TNT Equivalents, RP-HPLC (g/L)
0.9
STD Set A
0.8
STD Set B
STD Set C
Well 622
0.7
Well 743
Well 745
0.6
0.5
0.4
0.3
0.2
Figure 12. Serial dilutions of well
1
0.1
10
water compared with standard curve.
TNT (g/L)
dard curve. Each test runs with its own reference
dilutions are compared with the slope of the cali-
standard to mark the end-point of the color devel-
bration curve (Fig. 12), little or no matrix effect
opment. Duplicate analyses require another
was apparent. The wells from Umatilla and Bang-
matching reference standard. They also produce
or did appear to have a positive matrix interfer-
the quickest analyses: 10 minutes vs. 45 to 90 min-
ence. The most accurate determinations were
utes for the other kits. The use of concentration
achieved when samples required substantial
ranges for quantitation emphasizes the qualitative
dilution with deionized water to fall within the
nature of the analyses. Although not required, a
range of the kit. The largest deviations from RP-
TNT standard curve was produced using the
HPLC values occurred when samples were anal-
numerical values from the reflectometer (Fig. 13).
yzed without dilution. The cost of this kit is inter-
The standard curve published with the kit is quite
mediate and could be lowered approximately
different. The accuracy and precision of the analy-
50% by buying the assay tubes in bulk and run-
ses are plotted with references to the ranges speci-
ning only one standard and one negative control
fied on the color card and reflectometer conver-
each assay.
sion chart. In all cases, the reflectometer and color
card agreed. The ranges are filled in with fre-
DTECH
quency of occurrence values (Fig. 14). Except for
The DTECH kits are small and completely self-
one value in the 2545-g/L range, the kit overes-
contained field kits. The materials for four sam-
timated the RP-HPLC values. Multiplying the
ples could be carried in a large coat-pocket. They
range as detected by the dilution factor produced
do not include provisions for producing a stan-
12

 Previous Page
