25
20
15
10
5
FT #1
FT #2
0
145
150
155
160
170
180
Julian Days
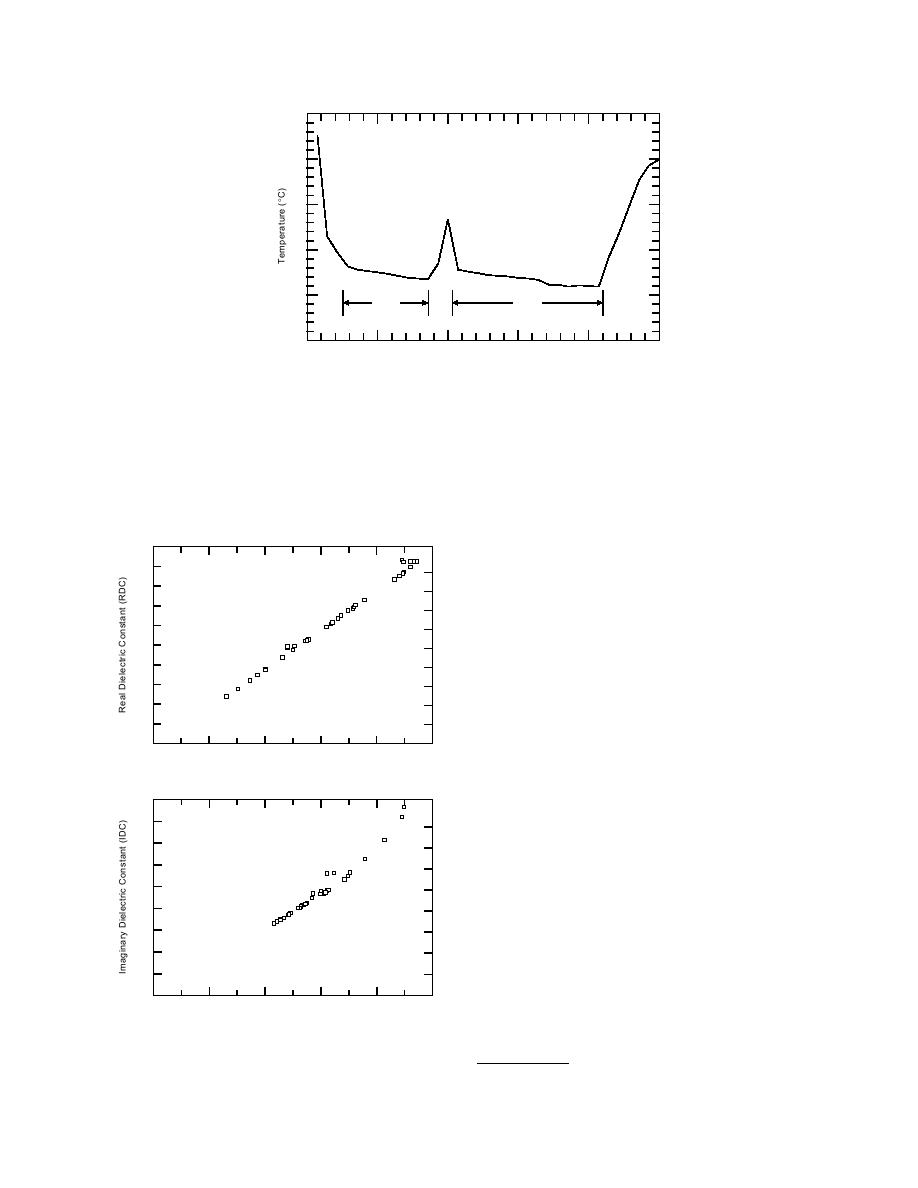
Figure 28. Soil temperature measured by Hydra probe 3 at 0600
each day when soil was frozen.
stant of the soil (Vitel, Inc. 1994). This constant
low-on experiments will be made exclusively in
gives the water content. However, the probes
the middle portion of the bin soil.
were wired so that they'd switch off and on to take
The absolute values for Hydra probe soil water
readings, but the switch failed and the probes re-
contents were inaccurate once a freeze began. The
mained on. The probes then heated up, which
probe uses the soil temperature it records to cal-
warmed the soil around them, and the tempera-
culate a temperature-corrected real dielectric con-
ture they recorded was incorrect. Probe 3 in the
25
surface soil between RGs C and D (Fig. 13) mea-
sured 68C above freezing (Fig. 28) when the sur-
24
face soil here was frozen. However, the relative
23
values for soil water are likely accurate because
22
the real dielectric constants vs. the temperature-
21
corrected constants recorded during these tests
20
are closely correlated (Fig. 29). The switch prob-
19
lem in the Hydra probe circuits will be corrected*
18
before the next experiments.
17
16
CONCLUSIONS
15
15
17
19
21
23
25
These initial tests suggest that the pattern of rill
TemperatureCorrected RDC
a. Real.
change attributable to FT-induced infilling that I
4.5
hypothesized may be appropriate and that such
infilling can dramatically alter the hydraulic ge-
4.0
ometry of a rill, which would substantially
3.5
affect the velocity of flows within it.
3.0
The patterns of frost penetration and thaw and
2.5
soil water redistribution suggest that the soil in
2.0
the bin froze and thawed in a natural manner,
which mimics that in the field. The heave of the
1.5
soil during freeze and its settlement and slumping
1.0
during thaw appeared to reasonably simulate the
0.5
response of an undisturbed field soil to FT cycles.
0.0
Thus, this type of soil bin with side and bottom rein-
0
1
2
3
4
5
TemperatureCorrected IDC
forcement to withstand vehicle loading can be used
b. Imaginary.
in future experiments on vehicular ruts.
Figure 29. Dielectric constants vs. temperature-
corrected constants.
* Personal communication with K. Knuth, CRREL, 1995.
28


 Previous Page
