Table 5. Rill hydraulic geometry measurements.
mid-rill during F2 (a reversal of that measured
during F1), and possibly the temperature gradi-
Bottom
Top
ent in the out-of-rill soil was greater.
width
width
Depth
P
A
R
During F2 the in-rill and out-of-rill soil surfac-
(cm2)
Profile
(cm)
(cm)
(cm)
(cm)
(cm)
es remained unchanged at profiles 3 and 5 (Fig.
1
19.0
19.9
13.2
46.7
257.5
5.5
22d and e) and there were minor changes at pro-
T1
1
11.8
27.9
12.4
42.3
246.1
5.8
files 1 and 7. After 6 hours of thawing, however,
T2
1
0
44.6
10.4
52.4
231.4
4.4
substantial side slope collapse had occurred and
3
18.1
20.2
12.7
43.5
242.7
5.6
T1
3
0
35.7
8.6
41.2
154.3
3.7
the rill was significantly wider and shallower
T2
3
0
64.5
7.8
66.0
250.8
3.8
(compare Fig. 24b and 26). Some 6 days after T2
5
16.7
20.2
12.7
42.6
233.6
5.5
began, the rill had filled in significantly (Fig. 22f)
T1
5
0
31.1
9.2
38.6
143.3
3.7
and the changes at profiles 3 and 5 were greater
T2
5
0
54.7
8.1
58.2
220.6
3.8
than after T1 (Fig. 22d).
7
17.3
19.9
12.7
42.9
235.4
5.5
T1
7
11.5
24.8
11.5
38.3
209.0
5.5
T2
7
0
41.8
10.4
48.7
216.5
4.4
ocity of a bankfull flow to decrease by 24% using
Manning's equation (eq 2) when keeping rill
slope (S) and roughness (n) constant. Thus, in this
hypothetical example, the erosivity of such a flow
in that rill could decrease significantly after one
FT cycle.
FT Cycle 2
Frost formation and thaw
The Tp was lowered and maintained between
7 and 13C (Fig. 18). The second freeze (F2) be-
gan at 159.13 when Ta reached 0C; Ta remained
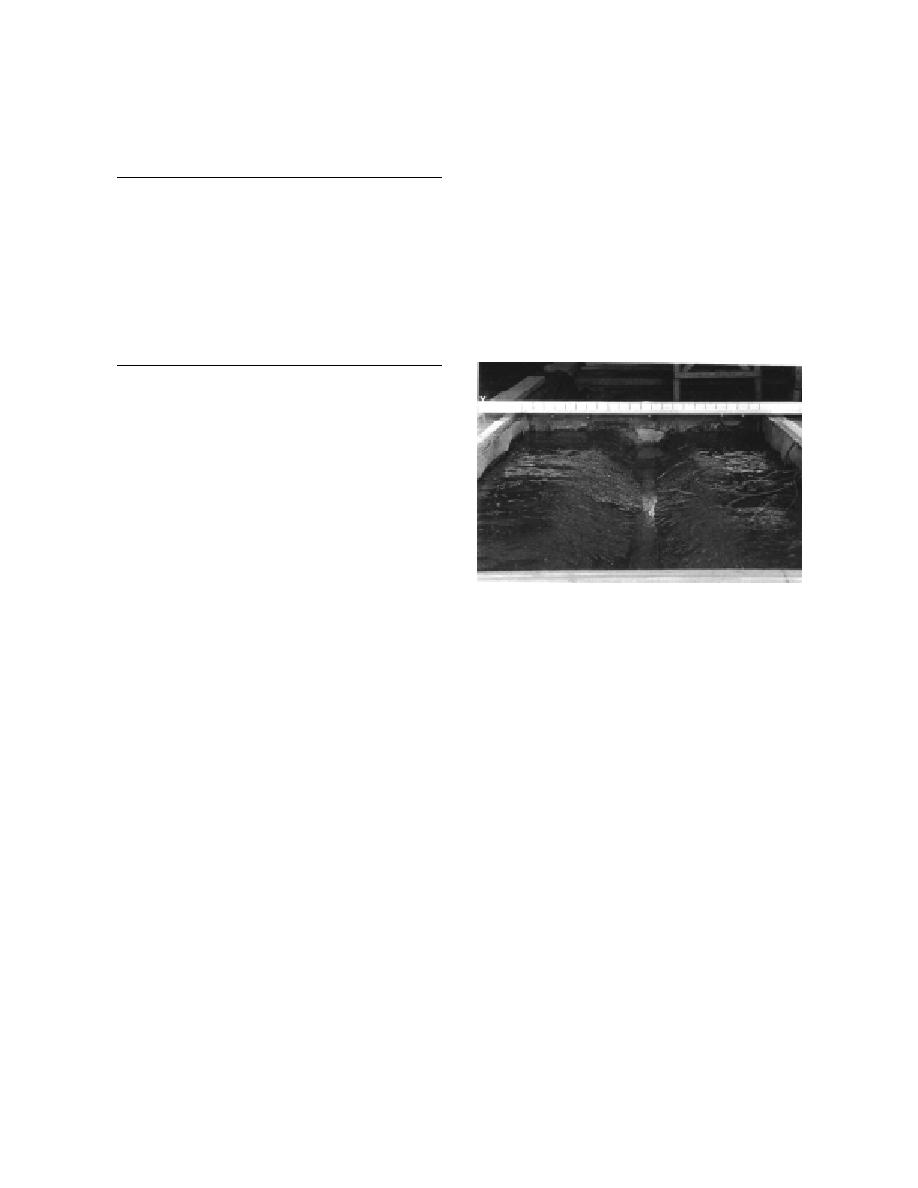
Figure 26. Rill shape 6-7 hours after T2 began.
between 4 and 6C until 174.08 (355 hours later)
when I removed the panels to begin T2. The soil
The R at profiles 1 and 7 decreased 24 and 20%,
surface at RG C reached 0C at 159.18 (Fig. 18b)
respectively, after T2 (Fig. 25), while the R at pro-
and the 0C isotherm penetrated to a depth of
files 3 and 5 was virtually unchanged. These de-
about 10 in. (25 cm) at both RGs, an average of
creases in rill R would reduce a hypothetical
0.03 in./hr (0.08 cm/hr) (Fig. 20c and d). The
bankfull flow velocity by 17 and 14%, respective-
frostline penetration rate averaged 0.03 in./hr at
ly. F2 lasted long enough to cause the near-wall
both RGs, as well (Fig. 20c and d). T2 was com-
parts of the rill to freeze sufficiently that there
plete at 177.09 at RG C and at 176.16 at RG D (Fig.
was substantial soil collapse there during thaw.
14), 73 and 56 hours, respectively, after the panels
Note the less dramatic shape changes at profiles 3
were removed. The soil at RG C froze deeper and
and 5 during F2. In regard to FT-induced changes
more completely than that at RG D and, thus,
in soil, numerous others (Chamberlain 1973,
took longer to thaw.
1981; Akram and Kemper 1979; Formanek et al.
1984; Yong et al. 1985; Van Klaveren 1987; Benoit
Rill hydraulic geometry
and Voorhees 1990; Othman and Benson 1993)
F2 lasted 122 hours longer than F1, and the Ta
have noted that the most dramatic change occurs
during F2 was generally 1 to 2C lower, causing
after one FT cycle, with lesser change following
more water to migrate to the freezing front,
subsequent cycles.
which resulted in more liquid water in the surface
soil being frozen longer during F2 (Fig. 21). All
LESSONS LEARNED
stations in and out of the rill heaved and the
amount of heave was greater during F2 (Table 4)
Rings 1 and 2 on the RGs responded appropri-
because of this additional frozen water. The out-
ately as a pair, but the others responded two pairs
of-rill soil heaved more than in-rill soil, just as
at a time rather than one pair at a time (Fig. 14).
during F1. The temperature of the soil surface at
Two ring pairs should not respond together be-
RG C was generally 0.1 to 0.3C lower than that in
cause the freezing front penetrated at 0.03 in./hr
26


 Previous Page
