5 10 3
Table 4. Measurements (24 s) of 0.5-g Pb pil-
low on and below several air-dried soil matri-
a. 0.25-mm Soil Barrier (0.5 g Pb)
4
ces held in a Lucite tube.
Pb L
Manual*
Instr.†
Soil
Depth
3
Soil
PbK
Comp.**
(ppm)
target
(cm)
2
Ottawa sand
Pb K
20
300
210
no
0
190
280
11000
yes
0
1
150
300
2300
yes
0.5
130
300
1300
yes
1.0
0
5
Rocky Mountain Arsenal
15
300
250
no
0
b. 1.0-mm Soil Barrier (0.5 g Pb)
210
260
12000
yes
0
4
205
300
3500
yes
0.5
165
300
3000
yes
1.0
3
Lebanon Landfill
35
280
380
no
0
Pb L
2
190
260
10000
yes
0
Pb K
135
280
2400
yes
0.5
1
125
280
2200
yes
1.0
CRREL soil
0
35
260
400
no
0
5
175
210
12000
yes
0
210
260
3800
yes
0.5
c. 2.0-mm Soil Barrier (0.5 g Pb)
155
260
4500
yes
1.0
4
Tampa Bay sediments
3
30
280
390
no
0
220
260
11000
yes
0
130
280
2600
yes
0.5
2
Pb L
120
280
1900
yes
1.0
Pb K
Ft. Edwards clay
1
10
220
89
no
0
145
210
11000
yes
0
130
220
2600
yes
0.5
0
50
100
150
200
250
110
220
3300
yes
1.0
Channel
* Manually measured fluorescent energies, baseline-
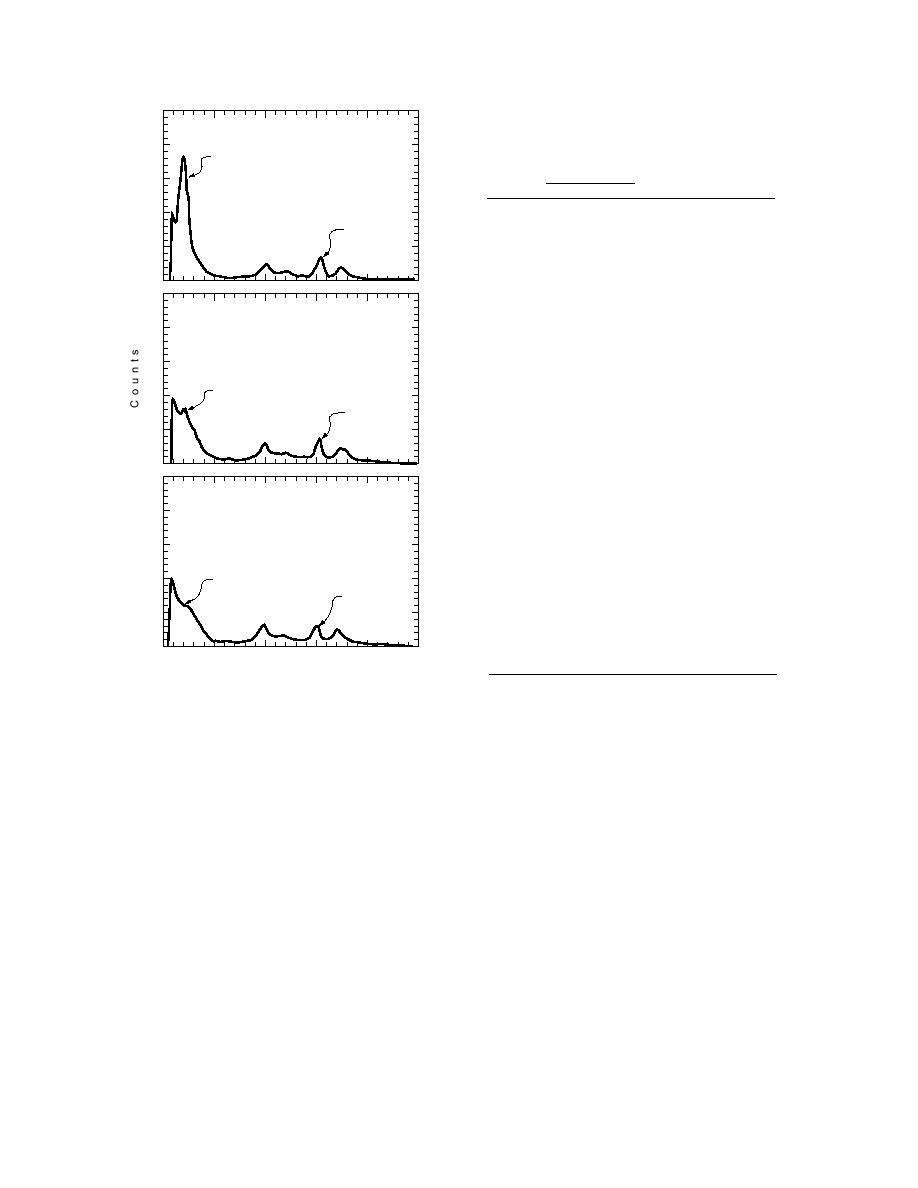
Figure 3. Illustrations of spectra obtained with the
corrected.
MAP-3 XRF analyzer for a Pb target beneath barriers
† Instrumental measurements based on Pb (mg/kg)
of soil.
in soil standards.
** Compton peak.
the rim, and then air-dried soil was transferred
of the background soil (no metal target present)
with a spatula to achieve various depths of cover-
resulted in negative values because the signal in-
age (the inner wall of the Lucite tube had 0.5-cm
tensity is actually lower at the appropriate chan-
increment markings, and the same soil placed
nels for Pb and Hg than the channels selected for
over the target was also used below it).
baseline correction.
Table 4 shows some of the measurements
Although no results are presented, this exper-
taken using a 24-s analysis period when a 0.5-g
iment was also performed with the 0.5-g Pb pil-
pillow of Pb was placed 1.0 cm below the rim of
low positioned at a depth of 2.0 cm (2.4 cm from
the Lucite tube and six different types of soil were
the detector source window). Under these condi-
used for coverings in 0.5-cm increments.
tions, the K line for Pb could only be distin-
Measurements taken in this fashion required that
guished from the baseline when there was either
the incident and fluorescent radiation pass
a 0.5-cm soil barrier or none at all. The results of
through a dry soil barrier or an air void of 1.4, 0.9,
these experiments indicate that the scanner does
or 0.4 mm, depending of the amount of covering.
not have to be in direct contact with the surface
The results of this experiment showed that the K
in order to measure these metals on or below the
line of Pb could easily be seen through 1.0 cm of
surface.
every type of soil tested. Manual measurements
6


 Previous Page
