5 10 3
5 10 3
c. Pb 0.5 g
a. Soil Background
4
4
Pb L
3
3
2
2
Electronic
Compton
Compton
Pb K
Noise
Backscatter
WK
WK
Backscatter
1
1
0
0
5
5
d. Hg 0.5 g
b. Pb + Hg 0.5 g/ea
4
4
PbL + Hg L
Hg L
3
3
2
2
Compton
Hg K
Hg K
Compton
Pb K
WK
Backscatter
WK
Backscatter
1
1
0
50
100
150
200
250
0
50
100
150
200
250
Channel
Channel
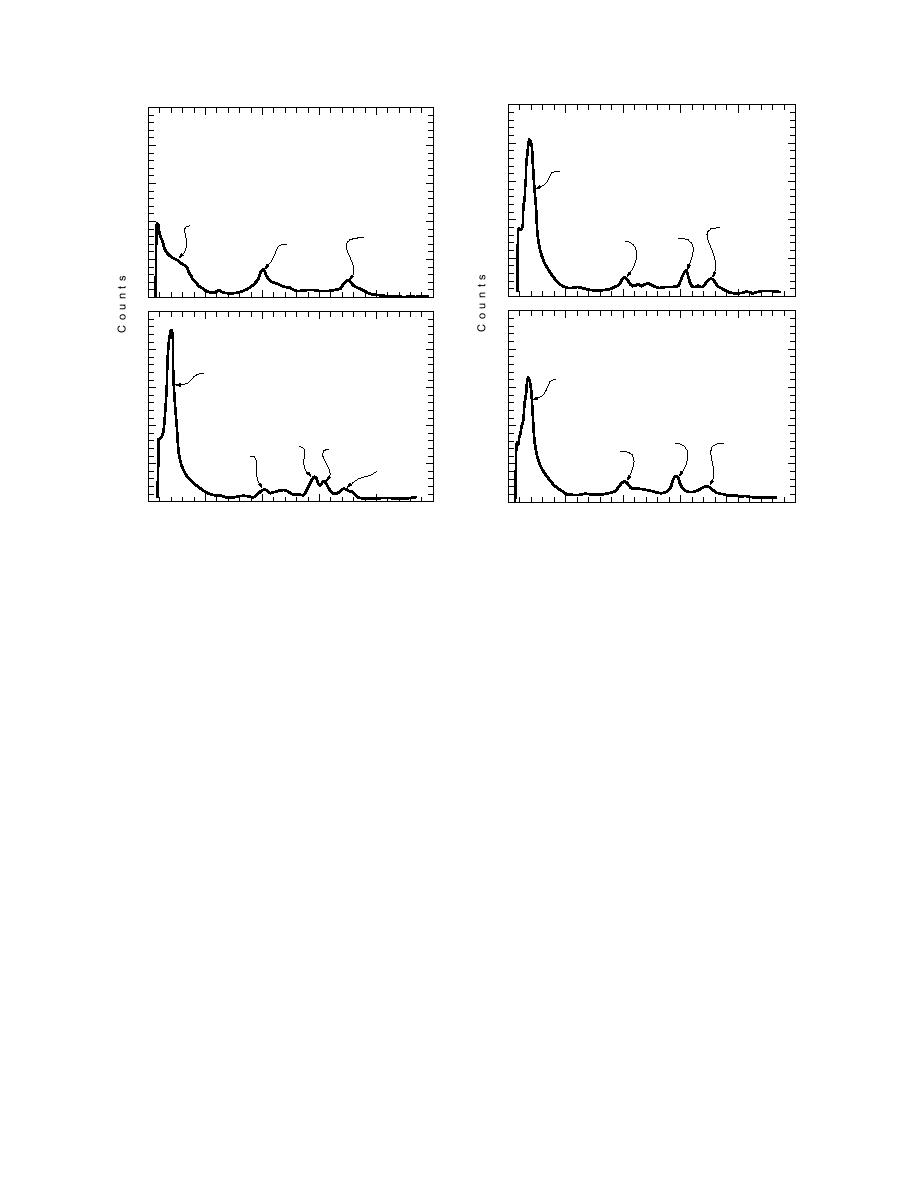
Figure 2. Spectra obtained with the MAP-3 XRF analyzer: a) a background soil, b) the 0.5-g Pb/Hg target on a soil
surface, c) the Pb target on a soil surface, and d) the Hg target on a soil surface.
Pb and/or Hg K-shell peak intensities are of
nel 1 to 50, a tungsten (W) K-shell peak in the
equal or greater magnitude than that of the
channel region 101 due to the composition of the
Compton peak, these metals are present at ex-
shutter for the source, and, in the region of chan-
tremely high concentrations (percent levels).
nel 176 (85 keV), the Compton backscatter peak.
In addition to these peaks, the three remaining
spectra show either or both of the L- and K-shell
Instrumental analysis
The SCITEC MAP-3 came preprogrammed
peaks of Pb and Hg. The L-shell peaks for these
two metals appear in the region of channel 26
with calibrations for Pb in both paint and soil.
(10.5 and 10.3 keV) superimposed over an elec-
The lead-in-paint calibration, which quantitively
tronic noise signal, and the K-shell peaks appear
assesses both the L and K lines of Pb, was used to
at channels 155 1 (75.0 keV) and 148 1 (70.8
check the instrument's performance on a daily
keV) for Pb and Hg, respectively.
basis. This sensitivity check, which took less than
Comparing all four spectra in Figure 2 also
5 minutes to perform, involved measuring a
shows how the intensity of the Compton peak
block of wood evenly coated with leaded paint.
changes inversely to the amount of heavy metals
Standards prepared for the analysis of metals in
present in the sample. In the spectra of the back-
soil matrices are homogeneous (finely ground),
ground soil (no target), the Compton peak has
but metallic primary explosives most likely exist
as salts. As a salt or salt aggregate, large discrep-
the highest intensity (400 counts); conversely, the
ancies in particle size are likely between primary
spectra of a sample with 0.5 g of both Pb and Hg
explosives and soil matrices. For this reason, the
on the soil surface has the lowest (250 counts).
analysis of the targets mentioned above, based
The Compton peak intensity changes because
the incoherent radiation backscatter that com-
on the factory calibration for Pb in soil (mg/kg),
prises it is caused mainly by light elements (i.e.,
served only as a relative measurement of the
oxygen, silica, etc.) in the sample matrix. As the
amount of this metal. In addition, instrumental
amount of heavier elements increases in the
measurements of many of the spectra were man-
matrix analyzed, the fluorescent energy from
ually interpreted by measuring the intensity of
light elements decreases. For instance, when the
the respective K lines, and sometimes the L lines
4


 Previous Page
