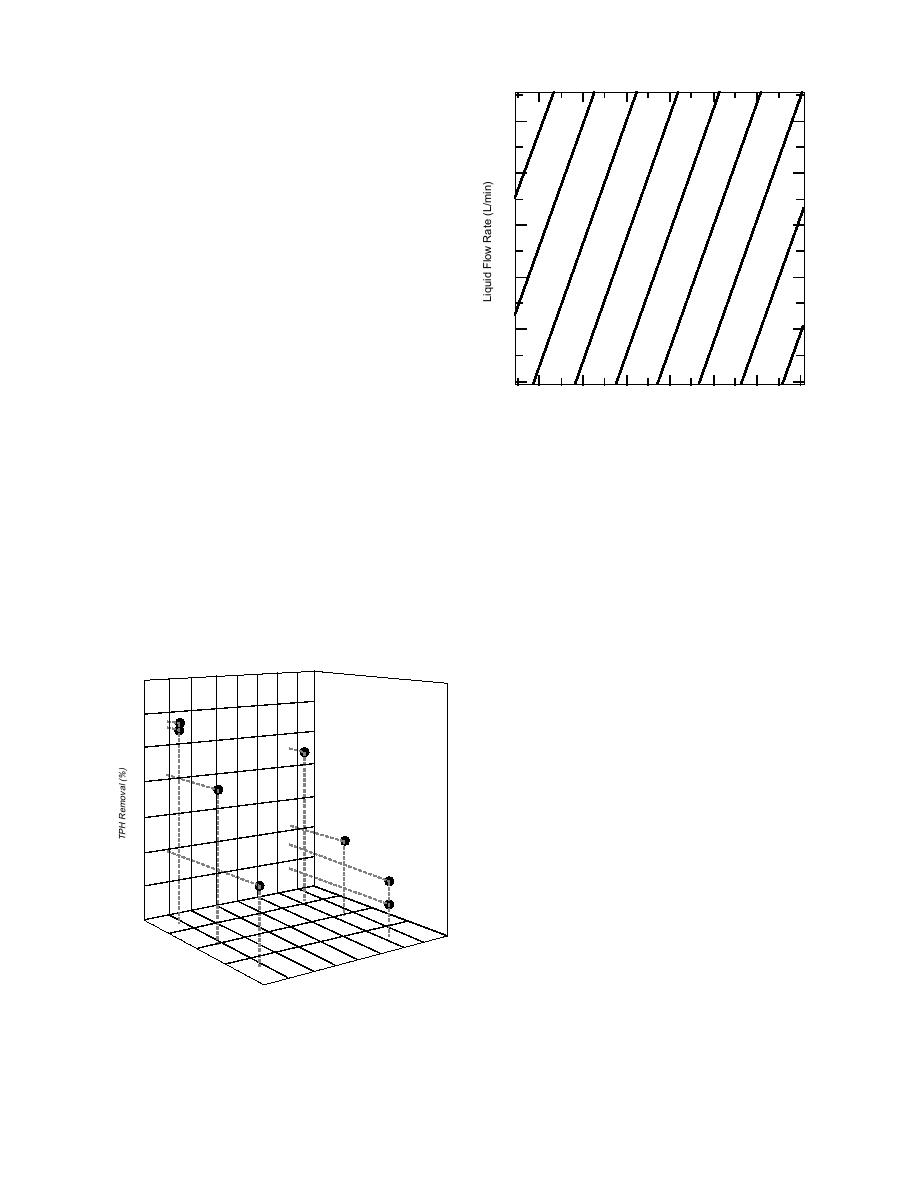
Predicted TPH Removal (%)
where RP = predicted future value of R
TL = influent liquid temperature (C)
45%
QL = influent liquid flow rate (liters/
70
50
minute).
55
According to eq 8, a one-degree increase in tem-
60
perature will result in a 2.61% ( 0.25%) increase
60
in TPH removal, and a unit increase in liquid
65
50
flow rate will decrease TPH removal by 0.22%
( 0.05%). The correlation coefficient for this equa-
70
tion, r2, equals 0.972. At the low flow rate (18.9 L/
75
40
min), eq 8 predicts that 100% TPH removal will
occur at 27.0C. However, as in the case for de-
80
creasing removal vs. flow rate, removal can rea-
30
sonably be expected to reach some asymptotic max-
85
imum as temperature increases. This predicted
maximum removal temperature is in good agree-
20
ment with vapor pressure data reported in the
10
12
14
16
18
20
22
Liquid Temperature (C)
literature for diesel range hydrocarbons (decane,
C10H22, through octacosane, C28H94). Vapor
Figure 7. Predicted response surface for TPH removal
pressure of a hydrocarbon-saturated liquid was
vs. liquid temperature and flow rate.
estimated (Franks 1966) to be roughly atmo-
spheric at 25C for the C10 through C20 hydrocar-
saturated gas phase and the liquid phase contain-
bons, which make up roughly two-thirds of the
ing the highest possible concentration of soluble
diesel range. A discussion of phase equilibria in
C10 through C16 hydrocarbons is expected at at-
water-hydrocarbon systems contained in API
mospheric pressure and 25C. The model (eq 8)
(1976) refers to Franks (1966) and others in defin-
ing 25C as the "maximum temperature for the
predicts this will occur in the ShallowTray strip-
per at atmospheric pressure and 27C. Equation 8
water-rich phase" of waterhydrocarbon systems
is shown graphically as a predicted response sur-
containing diesel range paraffins (C10 through
face in Figure 7. When lines are extended from
the x and y axes at known values of liquid tem-
perature and flow rate, they will intersect nearest
to the diagonal line that predicts the percent of
100
TPH removal.
Influence of experimental factors
on ShallowTray performance
80
The statistical estimate of the main effects and
factor interactions during ShallowTray stripping
of TCE, PCE and TPH was determined by analy-
sis of variance (ANOVA) of removal data. A sum-
60
mary of experimental parameter contributions to
contaminant removal is shown in Table 6. A con-
tribution below 15% is generally accepted as sta-
40
tistically insignificant.
The ANOVA results show that liquid flow rate
25
did not affect VOC removal, but liquid tempera-
20
Liq
ture was the most significant factor influencing
uid
80
15
Te
60
mp
TCE removal and somewhat significant to PCE
)
10
/min
era
te (L
40
tur
a
ow R
e(
id Fl
removal. The interaction of the two factors was
C
20
Liqu
5
)
the dominant factor influencing PCE removal but
was only somewhat significant to TCE removal.
Figure 6. TPH stripping performance (percentage re-
The interaction and error terms also increase with
moved) at three liquid temperatures and two flow rates.
11


 Previous Page
