10
Trial
Temp. Flow
(C) (L/min)
No.
Influent
Effluent
1
8.9
75.7
2
22.2
18.9
8
3
22.2
18.9
4
8.9
75.7
5
8.9
18.9
6
22.2
75.9
7
15.6
18.9
8
15.6
75.7
6
9
22.2
18.9
4
2
0
PQL = 0.302 ppm
1
2
3
4
5
6
7
8
9
Experimental Trials
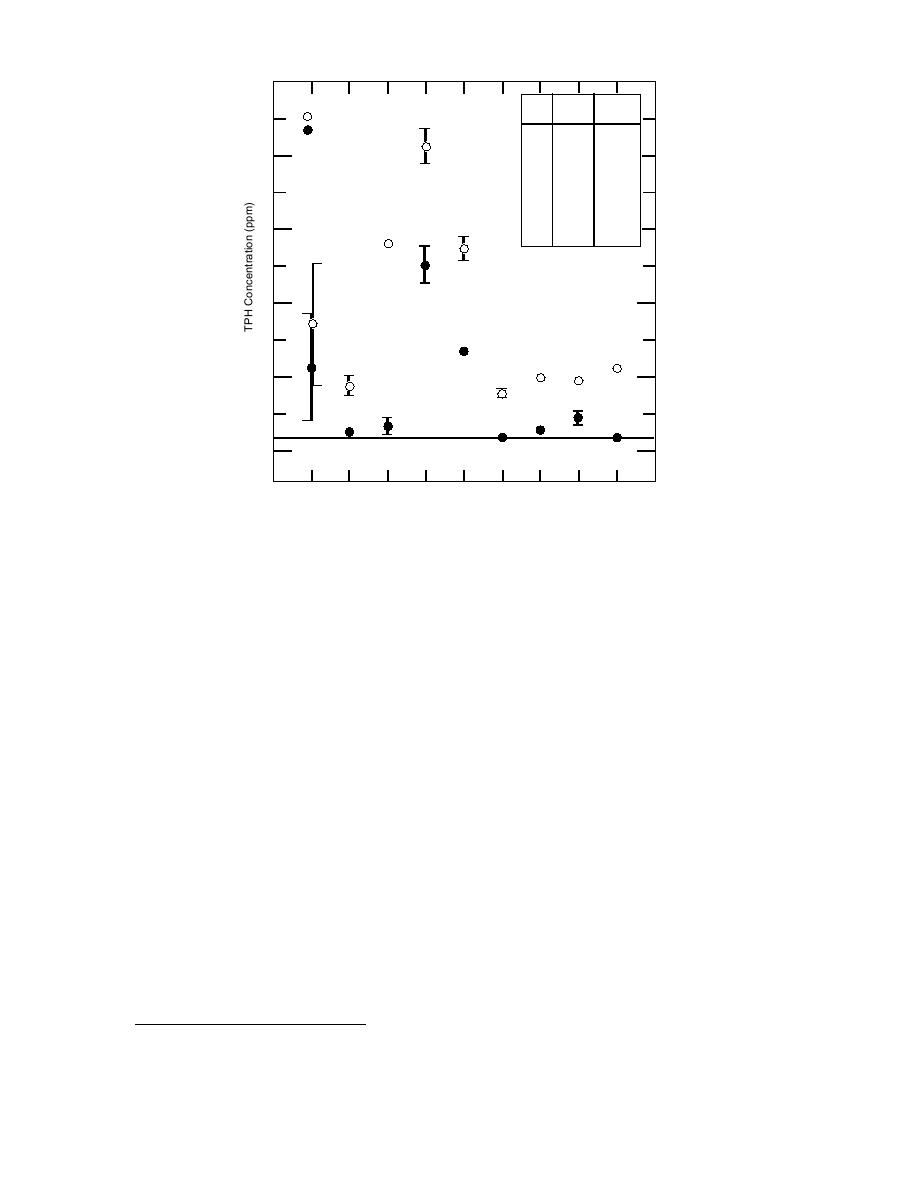
Figure 5. TPH pre-treatment and post-treatment concentrations for
all experimental trials
from left to right. The analytical PQL is low, just
When the data from eq 7 are graphed as a
0.3 ppm of TPH in water. Effluent concentrations
function of the two factors, the plot looks like
from several trials were at or just below the PQL.
Figure 6. Six data points result from the six pos-
The most significant removal trend was the
sible factor level combinations, and there are two
link between influent and effluent concentrations.
additional data points for the duplicate trials. This
Although a significant amount of TPH was
graph shows the strong linear relationship be-
stripped in every trial, the effluent concentrations
tween removal and increasing liquid tempera-
ture, and because there are three levels (data
were greater (or lesser) than the mean when in-
points) for the temperature factor the sums of
fluent concentrations were greater (or lesser) than
squares can be decomposed into polynomial ef-
the mean. Unlike VOC stripping, effluent TPH
fects (Ross 1985). Polynomial decomposition cal-
concentration appears to be dependent on influ-
culations confirm the relationship between TPH
ent TPH concentration. The driving force for TPH
*
removal and liquid temperature to be 300 times
is ( CL C0), irrespective of the compound of in-
more linear than quadratic. Although a quadratic
terest; properties of the compound are factored
vs. linear relationship between removal and liq-
into the value for KL. The trend of decreasing
uid flow rate cannot be ascertained from just two
influent TPH concentration over time is similar to
data points, a reasonable assumption is that re-
that observed for VOC concentrations and is also
moval will reach some asymptotic minimum vs.
due to dilution of contaminated source water with
increasing flow rate at a given liquid tempera-
treated recycled water. Student's t-tests performed
ture.
between each factor level combination showed all
A first-order regression was performed on the
removals to be significantly different at the 95%
results from eq 7, yielding a TPH removal predic-
confidence interval. The percentage of TPH re-
tor equation:
moval during each experiment was calculated as:
(avg. influent conc. - avg. effluent conc.)
Rp = 2.61 (TL ) 0.22 (QL ) + 33.72
(8)
R=
100 . (7)
avg. influent conc.
10


 Previous Page
