RESULTS
Data from stations
Data from the four basin stations and the
Hydrolab were collected over the period 519
Analysis of spoils samples
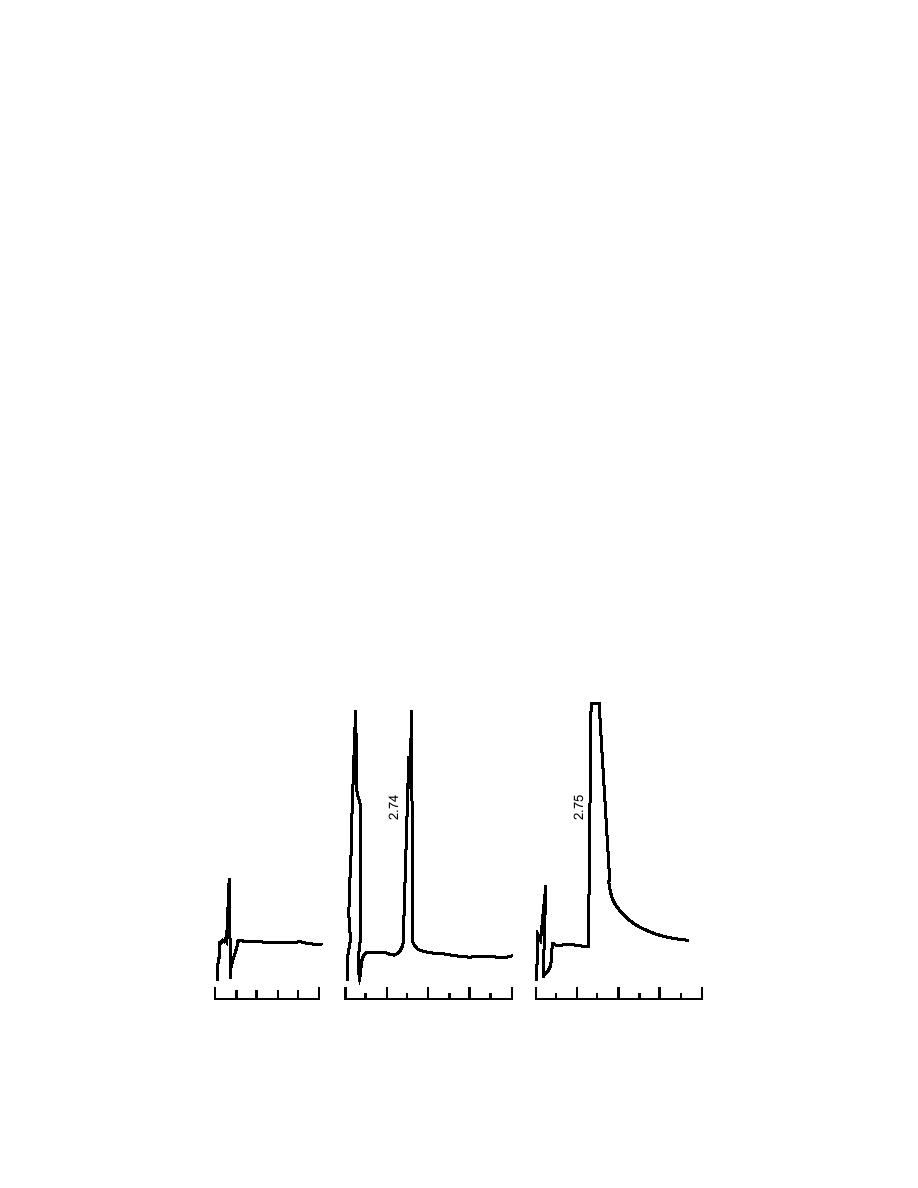
Two 500-mL samples from the spoils line were
October and 819 October, respectively. These data
obtained, one from each of the two days on which
are not important to this year 's work due to
dredging took place. These samples were analyzed
the limited amount of dredging that occurred.
at CRREL using an SRI gas chromatograph. Analy-
In addition, a 20-cm snowstorm on the 16th bi-
ses were performed by Marianne Walsh. The first
ased the Hydrolab data as well as the basin level
sample, taken on the 15th of October, indicated
readings. The most interesting data are tempera-
no white phosphorus present. The second sample
ture data, as they indicate the conditions under
was highly contaminated, with a concentration of
which dredging was conducted. Figure 29 is a
2.7 g/g, or 5843 g/L. This sample had to be di-
graphical representation of pertinent data from
luted 500:1 to read on scale on the instrument. For
these stations.
comparison, the WP calibration standard concen-
tration is 73 g/L. This indicates that a highly con-
Estimated dredged material quantity
taminated area in Clunie Inlet was dredged. A
An estimation of the material dredged is prob-
comparison of chromatograms is shown in
lematic due to the constraints imposed by the
Figure 28.
Safety Plan. However, we can get a rough estimate
There was no outflow of supernatant through
from the approximate area dredged. Using the
numbers stated above, a total of about 52 m3 of
the weir due to dredging activity, so no samples
were taken for analysis. On the 19th, some flow
material was removed from Clunie Inlet. An esti-
through the filter fabric on the weir as well as
mate of the mass of white phosphorus cannot be
through the filter fence due to snowmelt did oc-
made from the limited amount of data obtained.
cur, but no sampling was conducted as sampling
With the resumption of dredging activity next
equipment and containers had been put into stor-
spring, a larger database may allow a calculation
age for the next season.
of mass flow or quantity of WP removed.
Dredge Spoils:
Clunie Cr. Inlet
Calibration Standard
(73 g/L)
(16 Oct `94)
P4
Blank
0
5
0
2
4
6
8
0
2
4
6
8
Time (min)
Figure 28. Comparative chromatograms for spoils analysis.
31


 Previous Page
