Qs = 36.8 (Ph)/SG (∑hi) (m3/hour)
(12)
35 m long. Dredging occurred over a period of two
days, with a total of about three hours of actual
ph = (∑hi) (SG) (9.806) (Pa)
(13)
material removal occurring. Problems with flex-
ible hose connections and the loss of suction due
where
to dredge modifications (boom box) limited dredg-
SG = specific gravity
ing activities, and the onset of winter on the 16th
ρ = fluid density (kg/m3)
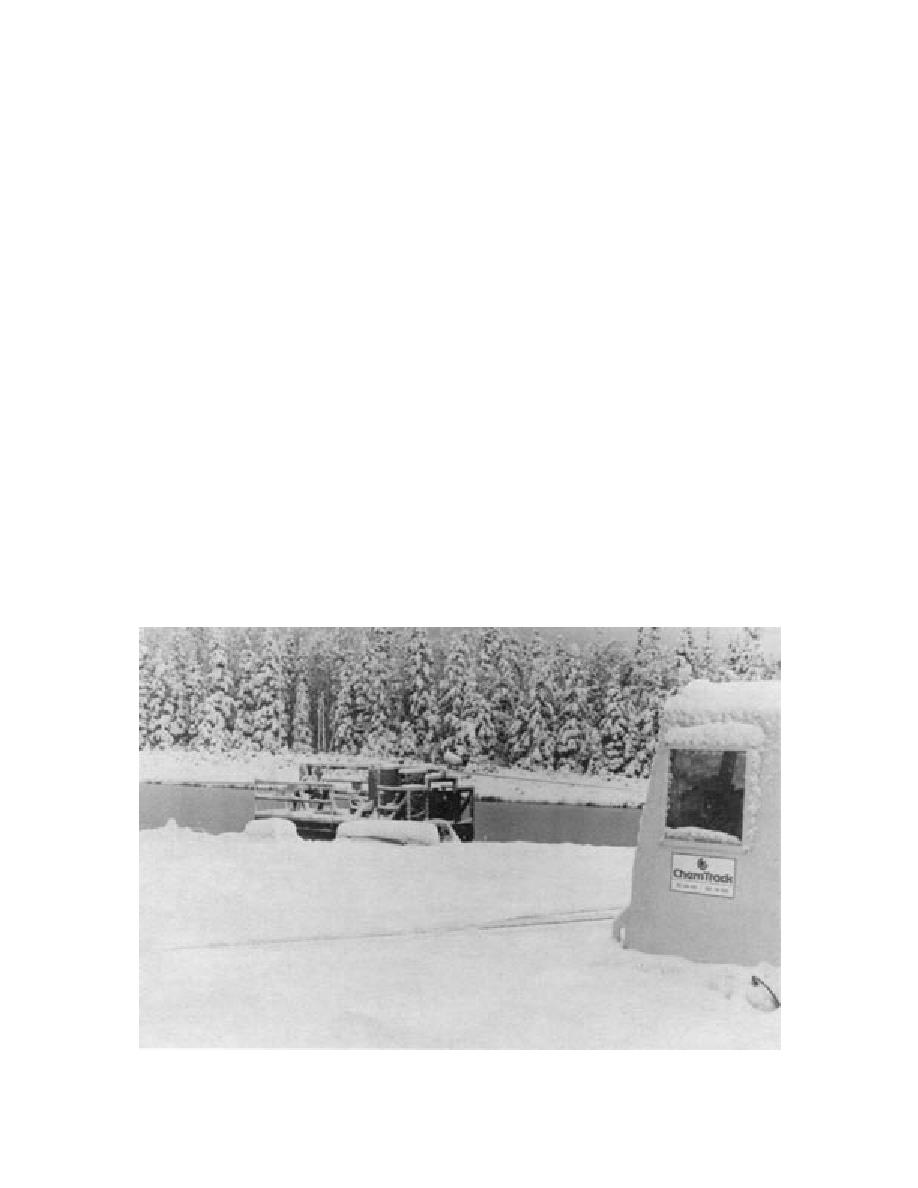
terminated operations (Fig. 27).
Qs = flow rate
During the active dredging, two samples were
Ph = power (kW)
obtained from the spoils line tap for future
hi = head components (kg)
analysis. One sample was taken during each day's
ph = line pressure.
pumping. Spoils outflow was also monitored from
behind the berm. A camera onboard the dredge
Even these relationships give only an indication
also recorded the process at the dredgehead. Some
of the system performance due to the vagaries of
suspended sediment in the vicinity of the
actual production, such as variable spoils ratio,
dredgehead was evident when pumping problems
fluctuating line velocities, and variable friction
occurred, but the water quickly cleared when
head losses.
pumping resumed. Observations at the spoils line
outflow pad indicate that a large amount of
Active dredging commenced on 15 October fol-
bottom vegetation was present in the area
lowing completion of pumping tests. Dredging
dredged. Production rates were not measured and
was restricted to the mouth of Clunie Creek adja-
cannot be estimated, as personnel had to be
cent to the ramp leading into the creek and out
below the top of the berm. The ratio of solids to su-
towards the point diagonally across the inlet.
pernatant in the samples taken from the spoils line
Dredged depth was 70100 cm from the water
was our only indication of production rate. The
surface, with dredged width of 2.5 m. The dredge
ratio in these samples was ≈ 10:1 water to soil.
removed material from a traverse approximately
Figure 27. Cessation of dredging activities.
30


 Previous Page
