3
10
4
10
Water on 13 cm
Peaty Silt
Target Maximum
5
10
Sludge on 16 cm
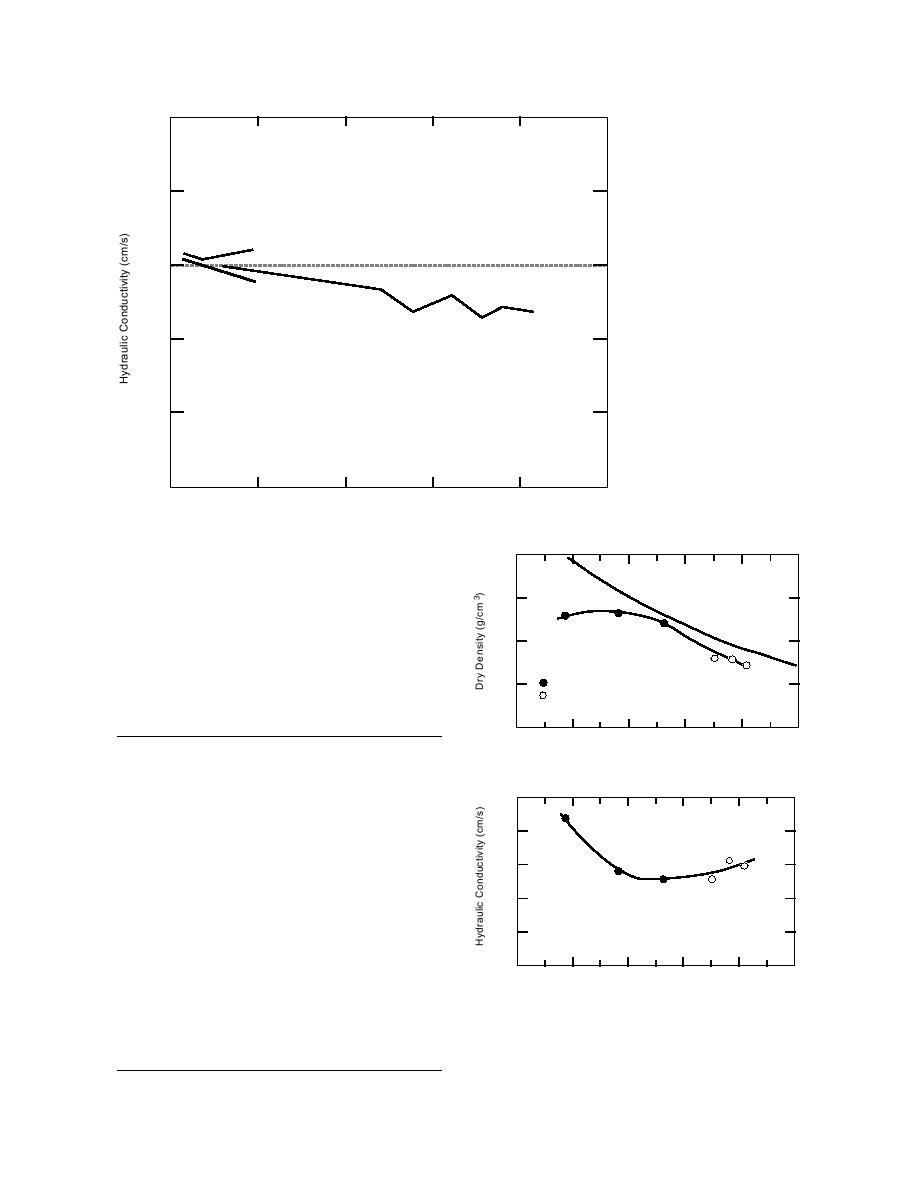
Figure 19. Results of barrel
Peaty Silt
infiltration tests for
Water on 20 cm
sediment on peaty silt liner.
6
Peaty Silt
10
7
10
10 8
0
5
10
15
20
25
Time (days)
1.4
a.
S = 100%
1.2
1.0
Table 10. Field infiltration tests in basin liner.
Lab Tests
0.8
Height of
Hydraulic
Field Tests
Time
water
(min)
(cm)
(cm/s)
0.6
Water on 13 cm peaty silt on gravel in basin
a. Dry density vs. water content.
0
15.75
0.6
1118
14.63
1.40E-05
10 3
2496
13.50
1.23E-05
6961
9.50
1.67E-05
b.
4
10
Sludge on 16 cm peaty silt on gravel in basin
0
10.50
5
10
1117
10.00
1.20E-05
2495
9.50
1.02E-05
10 6
6960
8.63
5.95E-06
10 7
Water on 20 cm peaty silt on gravel in basin
0
15.00
4460
13.25
9.42E-06
10 8
20
40
50
60
70
30
17765
11.00
4.74E-06
Compaction Water Content (%)
20269
10.80
2.48E-06
23515
10.40
3.94E-06
b. Hydraulic conductivity vs. water content.
26005
10.25
1.98E-06
27750
10.10
2.86E-06
Figure 20. Composite of lab and field permeability test
30510
9.90
2.45E-06
results for peaty silt.
23


 Previous Page
