found for the duplicate laboratory analyses, a
again, sampling error dominates over analytical
value very similar to that obtained for location 1.
error with both methods.
The poorer agreement for field duplicates may be
To compare the field and laboratory results, we
in part attributable to incomplete field homogeni-
again used both correlation analysis and a paired
zation, but may also be ascribable to the on-site
t-test (Table 2b). Correlation analysis of the log-
method for DNT not being as reproducible as it is
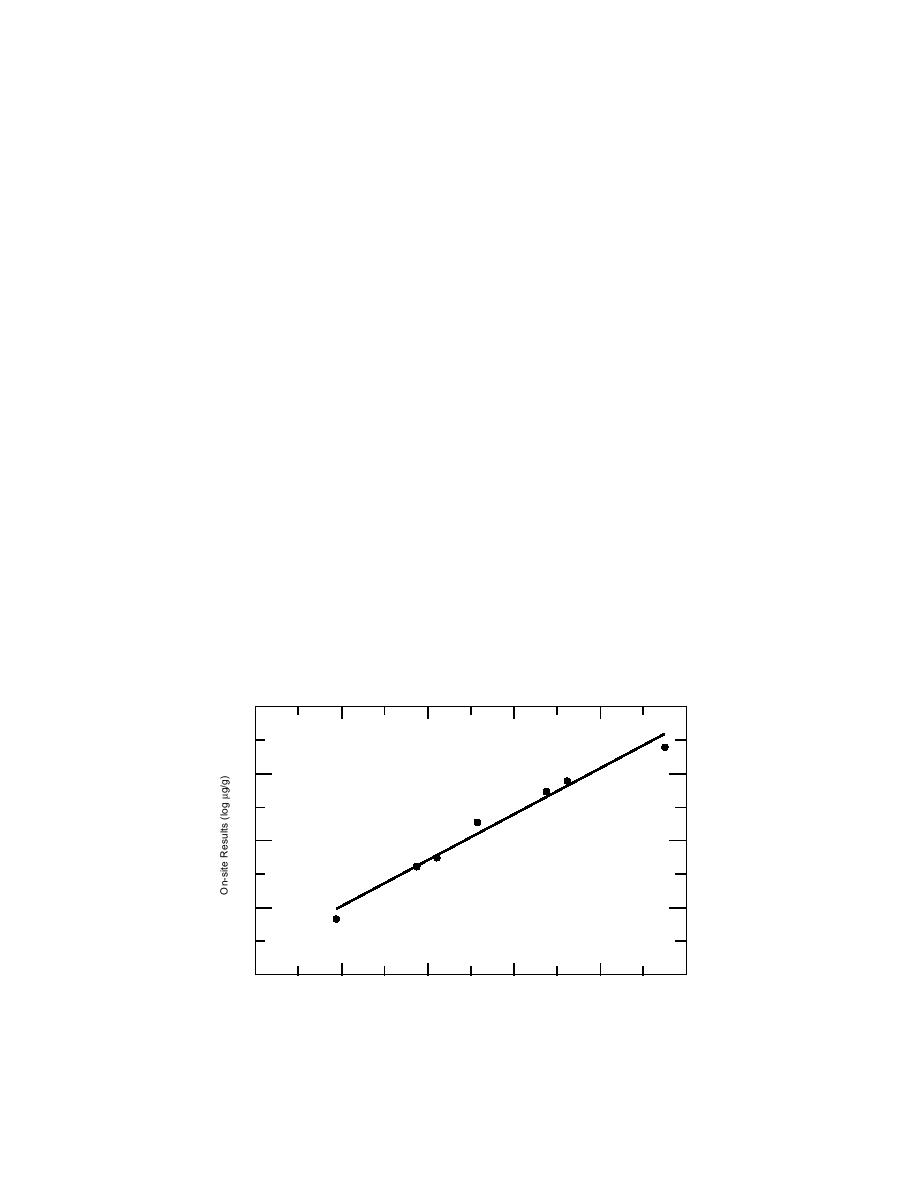
transformed results revealed a strong relation-
for TNT (Jenkins and Walsh 1991). In fact, EnSys
ship between the two methods (r = 0.988) but a
does not even market their reagent for on-site
slope of 0.684 was found for these log values,
analysis of DNT.
indicating a significant low bias for the field DNT
As discussed for location 1, mean concentra-
results (Fig. 5). The paired t-test confirmed this
tions and analytical variances differed significantly
bias with a value of 3.12, which is significant at
for samples at location 2. Thus, data did not ap-
the 95% level. Part of this bias is accounted for by
pear to be normally distributed and were log-
the laboratory total including TNT that is not
transformed. ANOVA and LSD tests were con-
fully accounted for in the on-site analysis when
ducted with the log-transformed data (Table 2b).
using measurements at 570 nm.
Even with the large analytical error for the field
The results from the analysis of the composite
results, a significant difference was found among
samples further confirmed the analytical bias de-
samples using ANOVA (F ratio = 22.3) at greater
tected for the discrete samples. A ratio of the mean
than the 99.9% confidence level, and many dis-
concentration for the on-site results divided by
crete samples at location 2 were significantly dif-
the lab results was 0.71. ANOVA was conducted
ferent from one another according to LSD analy-
to compare the on-site and lab results and an F
sis. A significant difference among samples was
ratio of 43.0 was found, which was significant at
also detected for the laboratory analyses (F ratio
the 99.9% level (Table 2b).
= 153) at greater than the 99.9% level, with more
The mean and standard deviation of the seven
differences detected among individuals using LSD
composites analyzed by the field method were
23,800 3140 g/g, which compared to a mean of
analysis. If we use the same simple approach for
comparing the uncertainties introduced by sam-
the seven discrete samples of 16,100. For the labo-
pling error and analytical error that we used for
ratory results, the mean and standard deviation
for the seven composites were 33,600 2390 g/g
location 1, ratios of highest to lowest means for
individual samples were 10.6 for on-site analyses
vs. a mean of the seven discrete samples of 34,800
g/g. Compositing again appears to provide a
and 33.4 for lab analyses. The maximum differ-
ences in duplicates ratios were 1.48 and 1.46 for
reliable estimate of the mean analyte concentra-
tion for the laboratory results. We initially thought
field and lab analyses respectively. Thus, here
4.8
4.4
4.0
r = 0.988
3.6
Slope = 0.684
y-intercept = 1.155
3.2
3.6
4.0
4.4
4.8
5.2
Laboratory Results (log g/g)
Figure 5. Log-transformed DNT concentrations from sampling location 2--
linear model with intercept.
14


 Previous Page
