5
4
3
2
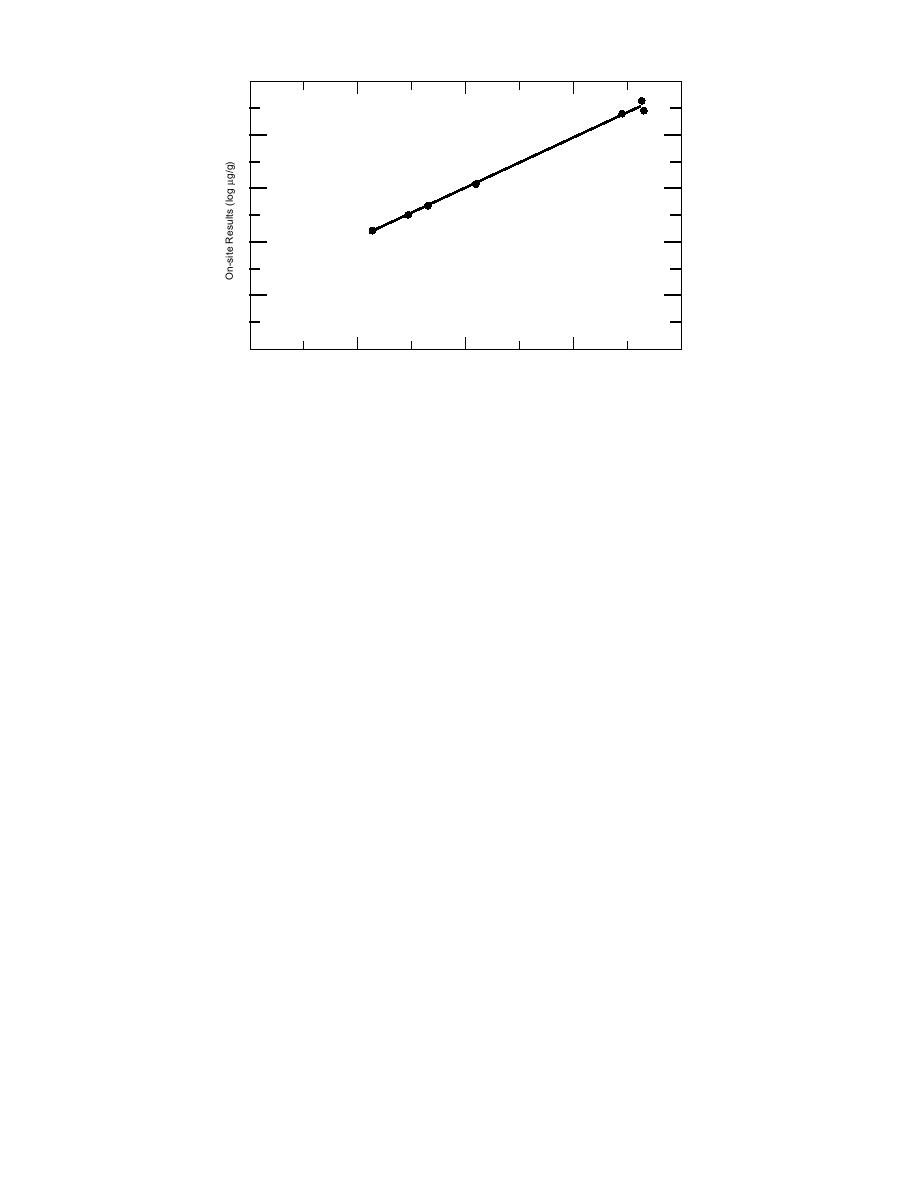
r = 0.999
Slope = 0.926
1
y-intercept = 0.251
0
2
3
4
5
1
Laboratory Results (log g/g)
Figure 4. Log-transformed TNT concentrations from sampling location 1--
linear model with intercept.
one another, except samples 1 and 4. Thus, for
intercept, and for the log-transformed values with
sampling location 1, very similar conclusions were
intercept (Table 1b). Correlation coefficients were
reached regarding the nature of the analyte distri-
0.973, 0.973 and 0.999 for untransformed data with
bution using either the results of on-site analyses
and without intercept and the log-transformed
or results of laboratory analyses.
data respectively. The correlation coefficient for
Because the mean concentrations and absolute
the zero intercept model is identical to that for the
analytical variances for various samples from site
model with non-zero intercept, and we interpret
1 differ so drastically, it is not possible to directly
this to mean that the intercept is not significantly
compare the uncertainties introduced by sam-
different from zero and that the accuracy of the
pling with those from analysis by partitioning
field method vs. the lab method can be estimated
variances of untransformed data using normal
from the slope of the best fit linear least squares
distribution statistics. ANOVA of the log-trans-
line (81.5%). The excellent correlation for the log-
formed data indicates that even the log concen-
transformed data, as shown in Figure 4, demon-
trations from various samples differ significantly
strates the equivalency of the results for the two
from one another, using analytical error as the
methods over several orders of magnitude of con-
yardstick.
centration.
A simple way to compare sampling and ana-
Paired t-tests were also conducted on the seven
lytical uncertainties is to compare the ratios of
mean values and the log-transformed mean data
extreme mean concentrations obtained for the
for the two methods of analysis (Table 1b). The t-
seven samples with those for duplicate analyses
value for the untransformed data was 1.35 and
from the same location. For location 1, the ratio of
that for the log-transformed data was 0.07, nei-
highest mean concentration to lowest mean con-
ther significant at the 95% confidence level. We
centration was 243 for the field analyses and 304
must acknowledge that comparison of the
for the laboratory analyses. The highest ratios for
untransformed results is not truly legitimate be-
duplicates were 1.16 for the field analyses and
cause the concentration distribution is non-
1.47 for the laboratory analyses. Thus, for this
Gaussian. Results of the paired t-tests agree with
location, sampling error contributes many times
those from correlation analysis, i.e., the labora-
more uncertainty than analytical error for either
tory and on-site results compare very favorably.
field or laboratory analysis.
Results of the analyses of the composite samples
Results for the field and laboratory analyses of
at sampling location 1 were also quite interesting.
these discrete samples were compared in two
The mean and standard deviation of the seven
ways. Linear correlation analysis was conducted
on-site analyses for the composite was 13,100
532 g/g in comparison to the mean of the
using the untransformed data with and without
11


 Previous Page
