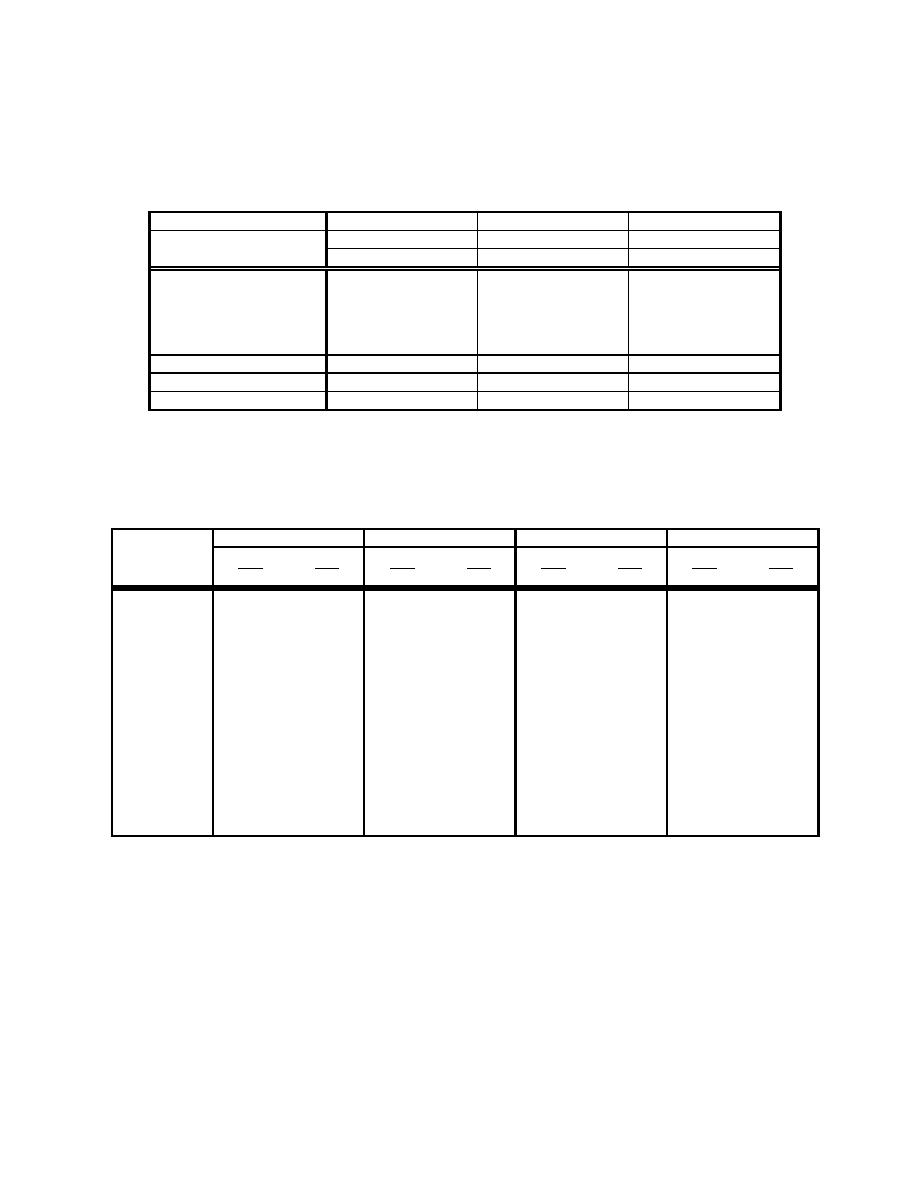
Ta ble B2. Percenta ges of una ccepta ble QC/ QA ra tios with th ree possible sets of rejection limits for
As, Ba , Cr, a nd Pb.
Re je cti on l i mi ts
0.254.00
0.303.00
0.402.50
Excl usi ons
Excl usi ons
Excl usi ons
Me ta l
Low
H i gh
Low
H i gh
Low
H i gh
As
2
4
2
8
7
9
Ba
4
2
4
2
8
4
Cr
3
0
4
2
4
2
Pb
4
1
6
1
11
2
S ubt ot a l s
13
7
16
13
30
17
Gra nd t ot a l s
20
29
47
Percent excl usi ons*
4.4%
6.3%
10.2%
* B a sed on 459 t ot a l resul t s.
Ta ble B3. Summa ry of reporting limits for Ag, Cd, Hg, a nd Se.
Ag
Cd
Hg
Se
N umbe r of
QA
QC
QA
QC
QA
QC
QA
QC
v a l ue s
105
93
76
60
85
101
98
104
Ra nge g/g
0.1010
0.1510
0.0465.2
0.215.0
0.0110.50 0.0500.50
0.06050
0.0905.0
Excl usi ons
4
3
1
1
2
2
3
1
New ra nge
0.103.1
0.152.9
0.0463.0
0.212.3
0.0110.30 0.0500.20
0.0603.0
0.0902.5
Mea n g/g
1.4
1.7
0.71
1.2
0.11
0.13
0.62
0.75
Medi a n g/g
1.7
2.0
0.54
1.0
0.10
0.10
0.50
0.60
* Users gui de
t o CLP, g/L
10
5
0.2
5
* S W -846
7
4
0.2
2
g/L
* V a l ues t a ken from pa ge D-2 (Ta bl e D-3) of ER 1110-1-263 (US ACE 1990).
Th e concent ra t i ons sh own a re for gui da nce; t h ey wi l l va ry wi t h di fferent sa mpl es a nd di fferent
ma t ri ces. Di rect compa ri son of t h ese va l ues wi t h t h e QC a nd QA i s not possi bl e beca use t h e
l a t t er concent ra t i ons a re g/g i n soi l wh i l e t h e reference va l ues a re g/L for a n ext ra ct .
28


 Previous Page
