SAMPLE CALCULATIONS FOR Cr DATA
S ee Ta bl e A1 for ra t i os a nd l oga ri t h ms.
Step 1.
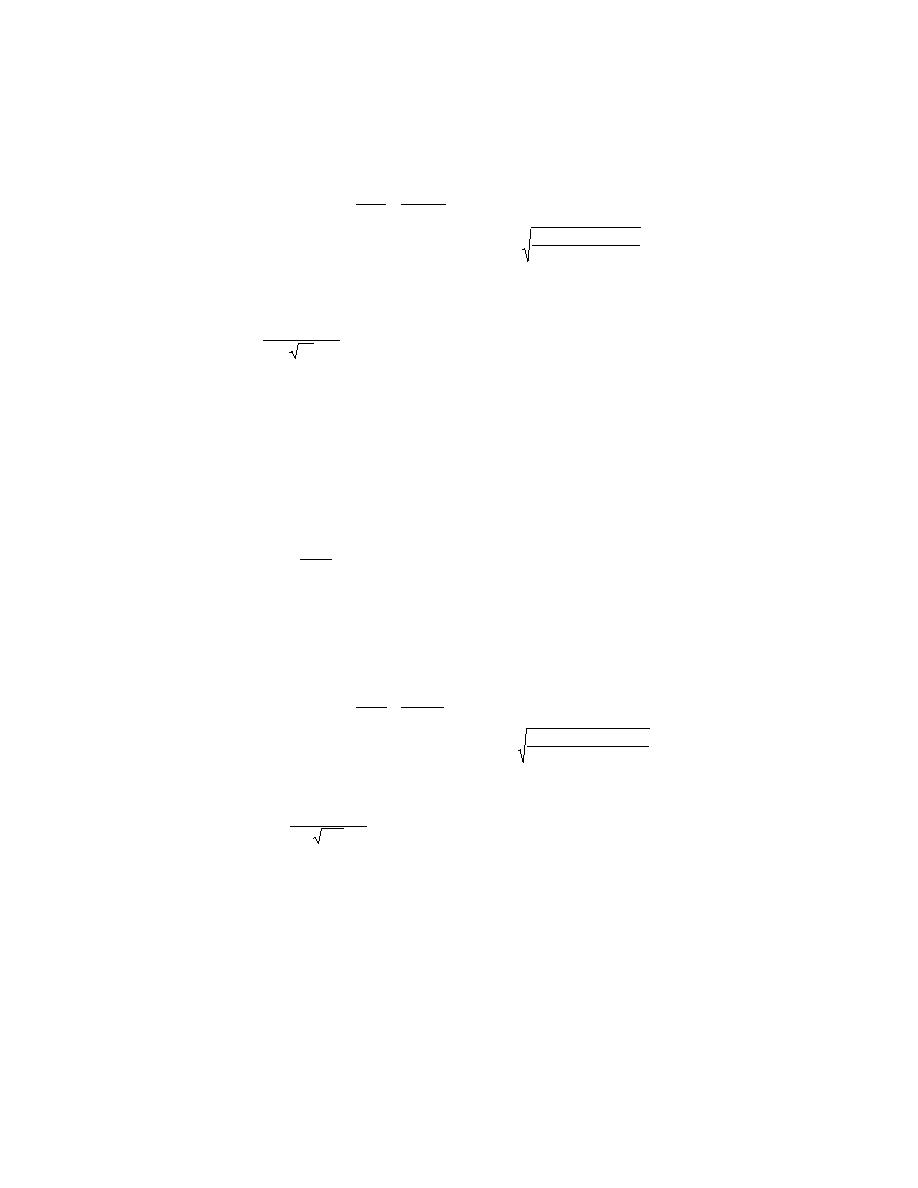
QC1 + 0.304
=
= + 0.0051 (antilog = 1.01) .
Mea n of l ogs of
Step 2.
60
QC2
0.83787 - 0.00154
Standard deviation (Sx ) =
= 0.119
59
.
95% confi dence l i mi t s on mea n of l ogs a re
Step 3.
(2.00)(0.119)
= +0.0051 0.0307; Prob [-0.0256 ≤ ≤ +0.0358] = 0.95 .
+0.0051
60
Ta ki ng a nt i l ogs, we get Prob [0.94 ≤ ≤ 1.09] = 0.95 .
Step 4.
Th e i dea l or expect ed mea n ra t i o of 1.00 i s wi t h i n t h e upper a nd l ower bounda ri es for 95%
confi dence l evel .
99% t ol era nce l i mi t s for l ogs a re
Step 5.
+0.0051 (2.66)(0.119) = +0.0051 0.3165; Prob [-0.3114 ≤ xi ≤ +0.3216] = 0.99 .
Ta ki ng a nt i l ogs, we get Prob [0.49 ≤ xi ≤ 2.10] = 0.99 .
Step 6.
QC1
ra t i os a re out si de of t h ese bounda ri es for i ndi vi dua l s;
Two of t h e 60
QC2
(M3 - 67 = 2.57, M3 - 74 = 2.18).
For t h e i dea l mea n l og of 0.00, Prob [-0.3165 ≤ xi ≤ +0.3165] = 0.99
Step 7.
Prob [0.48 ≤ xi ≤ 2.07] = 0.99 .
a nt i l ogs gi ve
Th e sa me t wo ra t i os a re st i l l out si de t h ese bounda ri es.
QC1 -3.712
=
= -0.0320 (antilog = 0.93)
Mea n of l ogs of
Step 8.
QA
116
3.355082 - 0.118784
Standard deviation (Sx ) =
= 0.168
115
95% confi dence l i mi t on mea n of l ogs
(1.98)(0.168)
-0.0320
= -0.0320 0.0309.
116
Prob [-0.0629 ≤ ≤ -0.0011] = 0.95 ; t a ki ng a nt i l ogs, we get
Prob [0.87 ≤ ≤ 1.00] = 0.95 .
Th e expect ed mea n of 1.00 i s ba rel y wi t h i n t h e upper bounda ry for 95% confi dence l evel .
99% t ol era nce l i mi t s for l ogs
-0.0320 (2.62)(0.168) = -0.0320 0.440 .
Prob [-0.472 ≤ xi ≤ +0.408] = 0.99; t a ki ng a nt i l ogs, we get
Prob [0.34 ≤ xi ≤ 2.56] = 0.99 .
25


 Previous Page
