0.4
GAWSER E
0.3
E
0.2
0.1
0
10
20
30
40
50
60
70
80
90
Time (h)
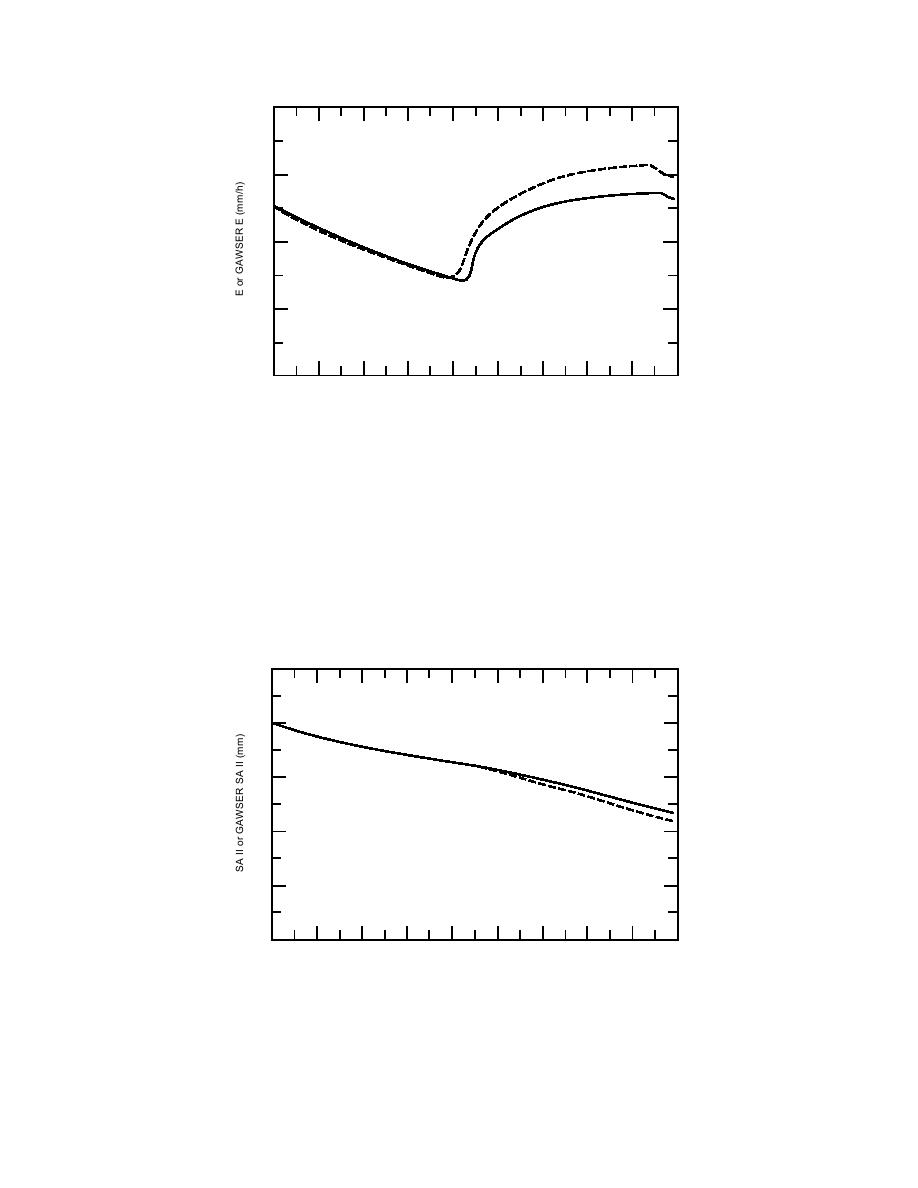
Figure 42. Seepage. GAWSER_E and E are identical from zero to five hours.
GAWSER_E is slightly smaller than E from five to 41 hours. GAWSER_E is greater
than E from 41 hours to the end of the simulation period. The difference between
GAWSER_E and E is due to the difference in SA_I and GAWSER_SA_I (see Fig. 39)
because SA_I is used to calculate E (see eq 36) and GAWSER_SA_I is used to calcu-
late GAWSER_E (see eq A.19 in Schroeter 1989).
when SA_I becomes larger than GAWSER_SA_I in Figure 39. The difference in magnitude be-
tween E and GAWSER_E is due to the difference between SA_I and GAWSER_SA_I because SA_I
is used to calculate E (eq 36).
Figure 43 shows the differences and similarities between SA_II and GAWSER SA_II. Both
curves are identical for the first 45 hours after which they diverge. After 45 hours, SA_II is slightly
larger than GAWSER SA_II. The difference between SA_II and GAWSER SA_II is due to the
100
80
60
SA II
GAWSER SA II
40
20
0
10
20
30
40
50
60
70
80
90
Time (h)
Figure 43. Available storage in the bottom soil layer. SA_II and GAWSER_SA_II
match identically until 46 hours when SA_II becomes larger than GAWSER_SA_II.
The divergence between SA_II and GAWSER_SA_II at 46 hours is due to the difference
between E and GAWSER_E (see Fig. 42). E decrements SA_II (see eq 28 and 32) and
GAWSER_E decrements GAWSER_SA_II (see eq A.21b of Schroeter 1989); therefore,
because E is less than GAWSER_E after 46 hours, SA_II should be greater than
GAWSER_SA_II after 46 hours.
49


 Previous Page
