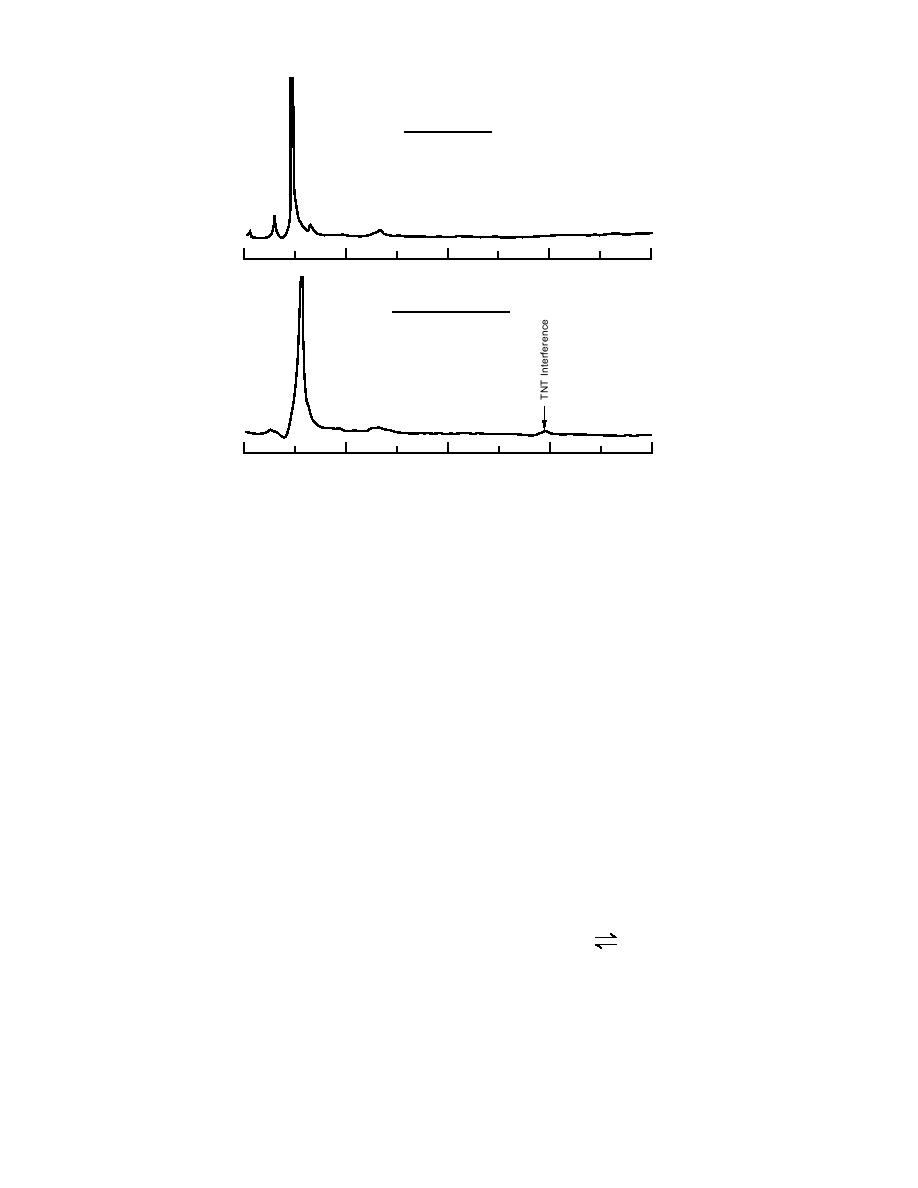
Well J; Unacidified
Well J; Acidified to pH 2
0
4
8
12
16
Retention Time (min)
Figure 22. Chromatograms for the acidified groundwater samples from
the Naval Surface Warfare Center.
The loss of TNB in several samples was accompa-
tion with acetonitrile or solid-phase extraction
nied by the appearance of 3,5-DNA, the expected
where the retained compounds were eluted with
transformation product. When TNT was either al-
acetonitrile, this peak was not observed, which
ready present, or fortified, at concentrations above
was also consistent with the hypothesis that it
about 150 g/L, no losses of TNT or TNB were
was due to the rubber-tipped plunger.
observed. This may be due to a toxicity effect on
the microorganisms present. Well F (Table A6) had
Problems with acidification for
a detectable concentration of 2,4-DNT, but only in
the amino compounds
the acidified portion. Apparently this analyte was
As discussed above, some decrease in concen-
unstable in this sample if not acidified. This result
tration was found for the amino-containing com-
is consistent with observations of Maskarinec et
pounds in acidified samples in the fortified
al. (1991). These results confirm that the stability
Connecticut River water, the three fortified
of TNT and TNB in unacidified groundwater
groundwaters, and some, but not all, of the field-
samples is very sample-specific, but that acidifi-
contaminated groundwaters from the NSWC. We
cation to pH 2 is a very effective stabilization tech-
initially suspected that this behavior was due to
nique for nitroaromatics.
protenation of a significant portion of the amino
Chromatograms obtained for the acidified
functional groups to form the corresponding am-
monium ions (HADNT+) at pH 2 (eq 1). This could
groundwater samples on the LC-18 column re-
vealed the presence of a small but detectable in-
result in low recovery of the parent amine when
terference with a similar retention time to TNT
conducting direct analysis using RP-HPLC.
(Fig. 22). This interference had been observed ear-
lier with acidified groundwater samples that had
HADNT+
ADNT + H+
(1)
been filtered using a syringe containing a rubber-
tipped plunger. Analysis of these samples on the
Ka = [ADNT] [H+] / [HADNT+]
(2)
LC-CN confirmation column indicated that this
peak was definitely not TNT. When these samples
The pKa values (eq 2) for the ammonium com-
were preconcentrated by a factor of 100 prior to
pounds corresponding to 4ADNT and 2ADNT are
analysis, using either salting-out solvent extrac-
21


 Previous Page
