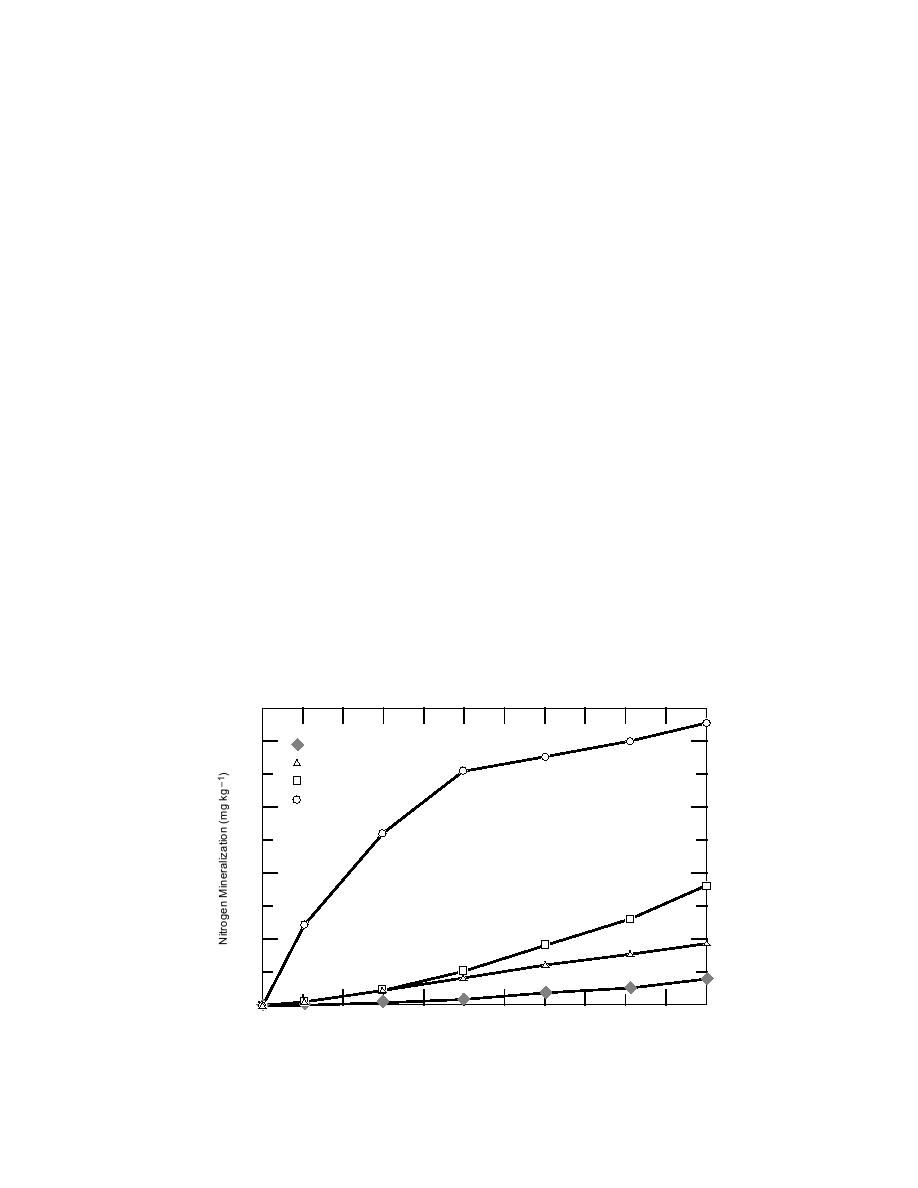
nential mineralization curve is typical of temper-
Many of the reactions controlling nitrogen
ate soils (Stanford and Smith 1972, Marion et al.
cycling (Fig. 5 ) are controlled by biological mech-
1981) but atypical of tundra soils in the tempera-
anisms. Examples include N2 fixation (bacteria),
ture ranges normally encountered in cold regions.
ammonification (bacteria and fungi), nitrification
The slow release of nitrogen at low temperatures
(bacteria), denitrification (bacteria), immobilization
(Fig. 6) may be due to the generally unfavorable
(bacteria and fungi) and uptake (plants) (Clark and
C/N ratios of the organic soils, which in one study
Rosswall 1981, Marion 1987). Some of the nitrogen
ranged from 18 to 82 (mean = 40) (Marion and Black
cycling processes can also be accomplished by
1987). Flanagan and Bunnell (1980) reported a sim-
strictly abiotic mechanisms [e.g., ammonification
ilar response for decomposers (CO2 production)
via fire (Marion et al. 1991) and chemodenitrifica-
tion (Christianson and Cho 1983)]. Nevertheless, it
that responded more linearly at low temperatures
is clear that biological processes play a dominant
and more exponentially at high temperatures.
role in controlling the flow of nitrogen as well as
Freezethaw cycles generally promote mineral-
other nutrients through terrestrial ecosystems.
ization (ammonification and nitrification) of organ-
The responsiveness of nitrogen cycling process-
ic nitrogen, which leads to increased concentrations
of NH+ and NO3 (Soulides and Allison 1961, Mack
es at low temperature is critical to assessing the
4
nitrogen supplying power of cold regions soils.
1963, Hinman 1970, Honnolainen and Reppo 1975,
Field measurements indicate net nitrogen miner-
Malhi and Nyborg 1979, 1986, Gersper et al. 1980).
alization at temperatures as low as 1C (Gersper et
An exception to this generality was reported by
al. 1980). Laboratory incubations have demonstrat-
Read and Cameron (1979), who monitored miner-
ed that nitrogen mineralization (ammonification
al nitrogen forms in several soil types over 10 years.
and nitrification) is less temperature sensitive at low
Between fall and spring, they found some increase
temperatures (39C) than at high temperatures
in NO3-N but a larger decrease in NH4-N, result-
(1535C) (Marion and Black 1987, Nadelhoffer et
ing in a net decrease in mineral nitrogen during
al. 1991, 1992). For example, at 35C, nitrogen min-
the winter. Malhi and Nyborg (1986) found large
eralization follows an exponential curve that shows
increases in mineral N when soils froze in the win-
a high initial rate of nitrogen mineralization fol-
ter and large decreases in early spring when soils
lowed by a gradually declining rate with time (Fig.
thawed; they attributed the spring loss to denitri-
6); on the other hand, at 5, 15 and 25C, nitrogen
fication and not to leaching of NO3 . Christianson
mineralization follows a parabolic curve that shows
and Cho (1983) found that the maximum produc-
a low initial rate of nitrogen mineralization fol-
tion of N2 gas via chemodenitrification occurred
at 3.5C over the temperature range from 20 to
lowed by a gradual increase with time. The expo-
5C
800
15C
25C
35C
600
400
200
0
2
4
6
8
10
Incubation Time (weeks)
Figure 6. Cumulative nitrogen mineralization with time and temperature for an
organic tundra soil. (After Marion and Black 1987.)
12


 Previous Page
