0
2
Lim
itin
gS
lop
e=
4
1
.86
C
/νm
MgSO4
6
Na2SO4
NaCl
8
0
1
2
3
4
Solute Molality (νm)
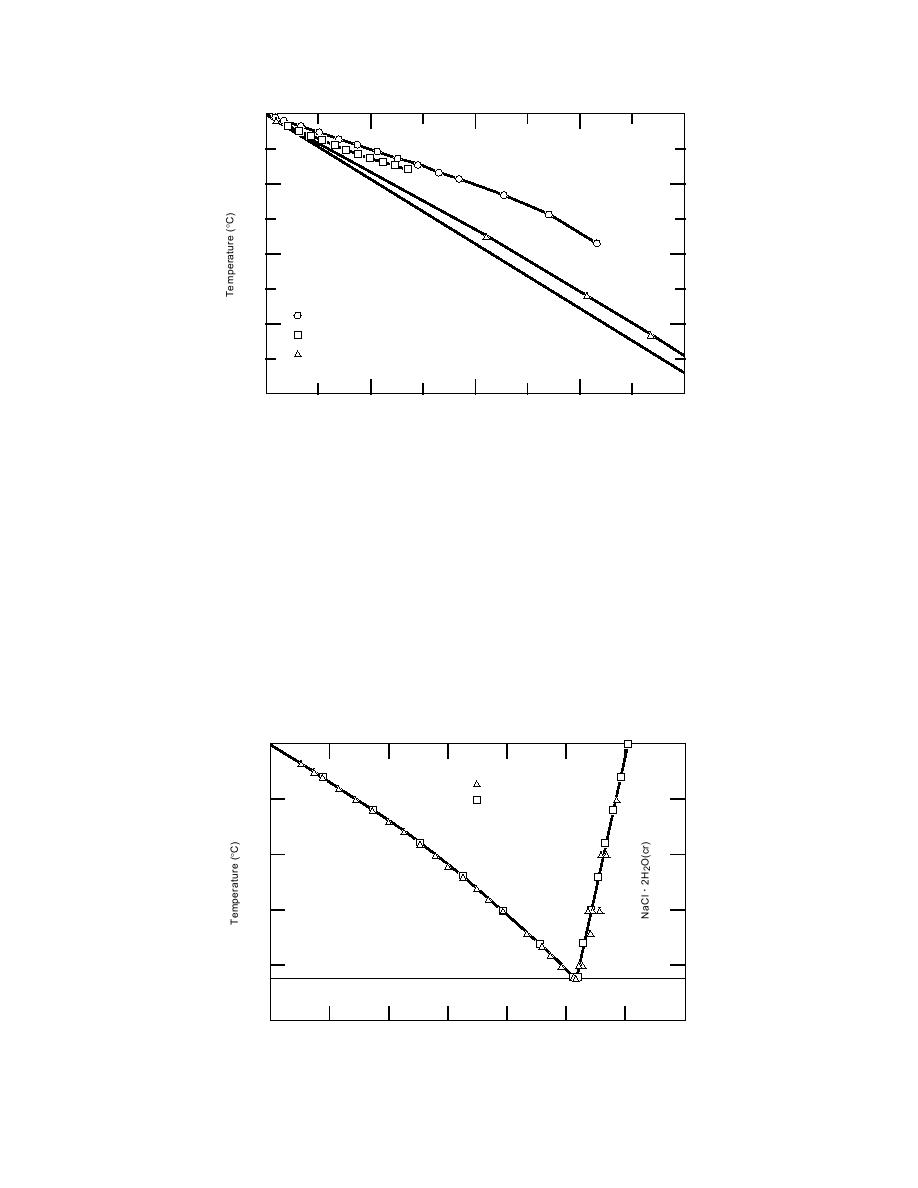
Figure 1. Freezing-point depression for three salt solutions. The data were taken
from Linke (1965).
ing, then the NaCl concentration in solution will
phase diagram for the H2ONaCl system at sub-
follow the icesolution equilibrium line, increas-
zero temperatures (Fig. 2) is very useful in describ-
ing in concentration as temperature decreases until
ing the change in the solution phase as ice and
it reaches the eutectic composition at 21.2C and
NaCl precipitate during the freezing process.
5.17 mol kg1, at which point the residual solution
Assume an initial NaCl concentration of 1.00 mol
kg1 and an initial temperature of 0C. As this so-
will solidify as a mixture of ice and NaCl . 2H2O.
lution cools below 0C, the NaCl concentration will
The phase diagram (Fig. 2) can be used to esti-
mate the unfrozen water content at any point in
remain constant until the temperature reaches
3.3C, when ice, largely a pure phase, will begin
the freezing process. To facilitate these calculations,
the following polynomial equations were fitted to
to precipitate, concentrating NaCl in the remain-
the ice-solution and solution-NaCl . 2H2O equilib-
ing unfrozen solution. If equilibrium is maintained
rium data:
between the solution and ice phases during freez-
0
Experimental
5
Model
10
Solution
Ice
15
20
Eutectic Temperature
Ice + NaCl . 2H2O(cr)
25
0
1
5
6
7
2
3
4
NaCl Molality (mol kg 1)
Figure 2. Stability diagram for the NaClH2O system at subzero temperatures.
2


 Previous Page
