Set 2, Soil "C" adjusted Concentration (g/g)
Set 2, Soil "C" adjusted Concentration (g/g)
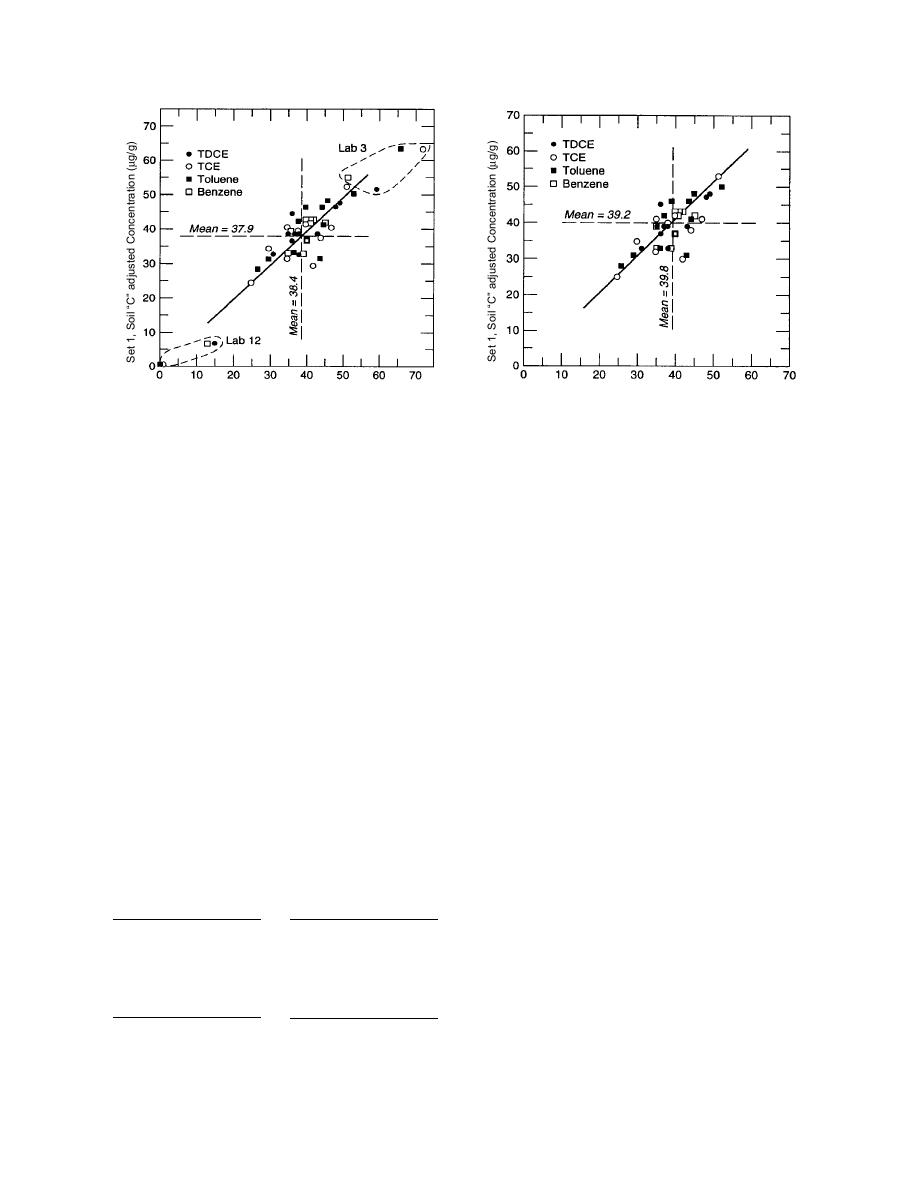
Figure 1. Youden two-sample plot for four analytes
Figure 2. Youden two-sample plot for four analytes
in soil C as reported by 12 laboratories. Concentra-
in soil C as reported by 10 laboratories (laboratories
tions of the 12 pairs of results for TDCE, TCE and Tol
3 and 12 excluded). Concentrations of the 10 pairs of
results for TCE and Tol were adjusted to 39.5 g/g
were adjusted to the same mean as Ben by subtracting
0.3, 18.4 and 23.4 g/g, respectively, to permit plotting
(both TDCE and Ben had this mean) by subtracting
16.7 and 24.0 g/g, respectively.
on a single graph.
soils 4 analytes), the lowest possible score was 12
worth noting that the results for Ben cluster much
and the highest was 144. For completely random
more closely around the intersection of the means
data, 5% two-tail probability limits are 44 and 112.
than any other analyte. Later precision estimates
Laboratory 3 (with a score of 17) and laboratory 12
confirm that the most reproducible concentration
(with a score of 135.5) exhibited pronounced sys-
estimates were for Ben.
tematic error, justifying their exclusion. Calibration
errors were likely the cause of this problem.
Laboratory ranking test
Because of the elliptical pattern of Figure 2, it
Before excluding all results from laboratories 3
was not too surprising that two more laboratories
and 12, a ranking test was conducted (Youden
were also outside of the limiting scores (but only
and Steiner 1975). The laboratories were ranked
slightly). As with 3 and 12, one was out on the high
for each analyte in each soil according to the
side and one was out on the low side. However,
means of the two batches. Thus, for each analyte
we were reluctant to exclude these data given the
in each soil, rank 1 was assigned to the laboratory
relatively small number of laboratories. Retention
with the highest concentration and so on to rank
of these results did not significantly alter mean
12 for the lowest concentration. The final score for
concentration estimates but it did increase the con-
each laboratory was the sum of its ranks (Table 4).
fidence limits around the means.
For 12 laboratories reporting 12 concentrations (3
Dixon's test
Table 4. Results of laboratory ranking test.
This test uncovers individual stray results, i.e. it
Laboratory
Sum of 12 ranks
Laboratory
Sum of 12 ranks
is sensitive to values that fall outside the range ex-
pected for randomly distributed data (Dixon 1953).
9
67
1
110.5
Only one result was classified as an outlier (α =
10
88.5
3
17*
11
56.5
4
85
0.05) using this test, and that result was barely ex-
12
135.5*
118.5†
5
cludable, so it was retained.
15
68
7
84.5
16
67
39†
8
Range test on duplicates
* The 95% confidence limit scores for a random process are
A basic premise of analysis of variance (ANOVA) is
44 and 112. Laboratories 3 and 12 are strongly biased.
homogeneity of variances. A range test was conduct-
† Laboratories 5 and 8 also show significant bias but the re-
ed on the duplicate values from batches (Youden and
sults were not excluded.
5


 Previous Page
