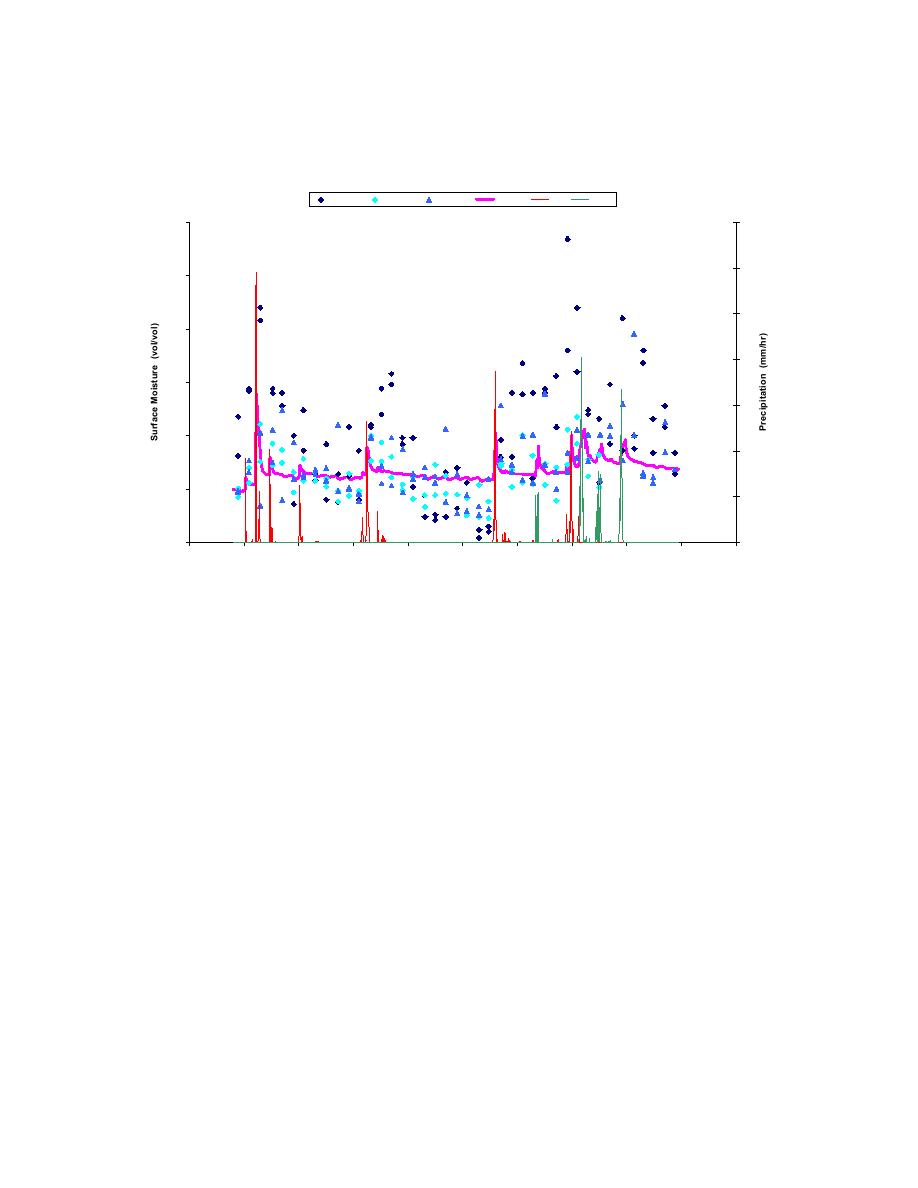
calculations are well within the spread of the measurements and respond to precipitation
events as seen in Figure 5.3. Soil parameters were chosen to obtain the best fit.
Grayling, MI 1
WES 1
WES 2
CRREL
FASST
rain
snow
0.3
14
12
0.25
10
0.2
8
0.15
6
0.1
4
0.05
2
0
0
255
260
265
270
275
280
285
290
295
300
305
Day of the Year
Figure 5.3 Soil moisture comparisons for Grayling, MI, 1992.
We used the CRREL daily measurement for Yuma, AZ, taken on day 74, the first day of
the experiment, to initialize the surface soil moisture content. The moisture content at
depth was initialized using the procedure discussed in Chapter 11, Section 11.2. The soil
is user-specified SM, or silty sand. Overall, the model does fairly well predicting the soil
moisture, as can be seen in Figure 5.4. It is certainly within the measurement error of the
probes used by WES and CRREL. The daily fluctuations are due to changes in
evaporation/condensation.
Since no specific soil type except for sand was recorded for Grayling, we investigated the
effect of soil type on the moisture content. As with the surface temperature data, there
were only small differences in the model results for the different soil types as seen in
Figure 5.5. Unlike the saturated hydraulic conductivity values used to generate the results
shown in Figures 5.3 and 5.4, the default values used to generate the results in Figure 5.5
are much smaller and, therefore, no daily oscillations are observed. In all the figures, it is
evident that soil moisture measurements are inexact, with as much as a 10% difference
exhibited on a given day.
49


 Previous Page
