Yuma, AZ Sand
100000000
10000000
1000000
100000
10000
1000
100
10
1
0
0.05
0.1
0.15
0.2
0.25
0.3
0.35
0.4
0.45
0.1
0.01
0.001
0.0001
0.00001
soil moisture
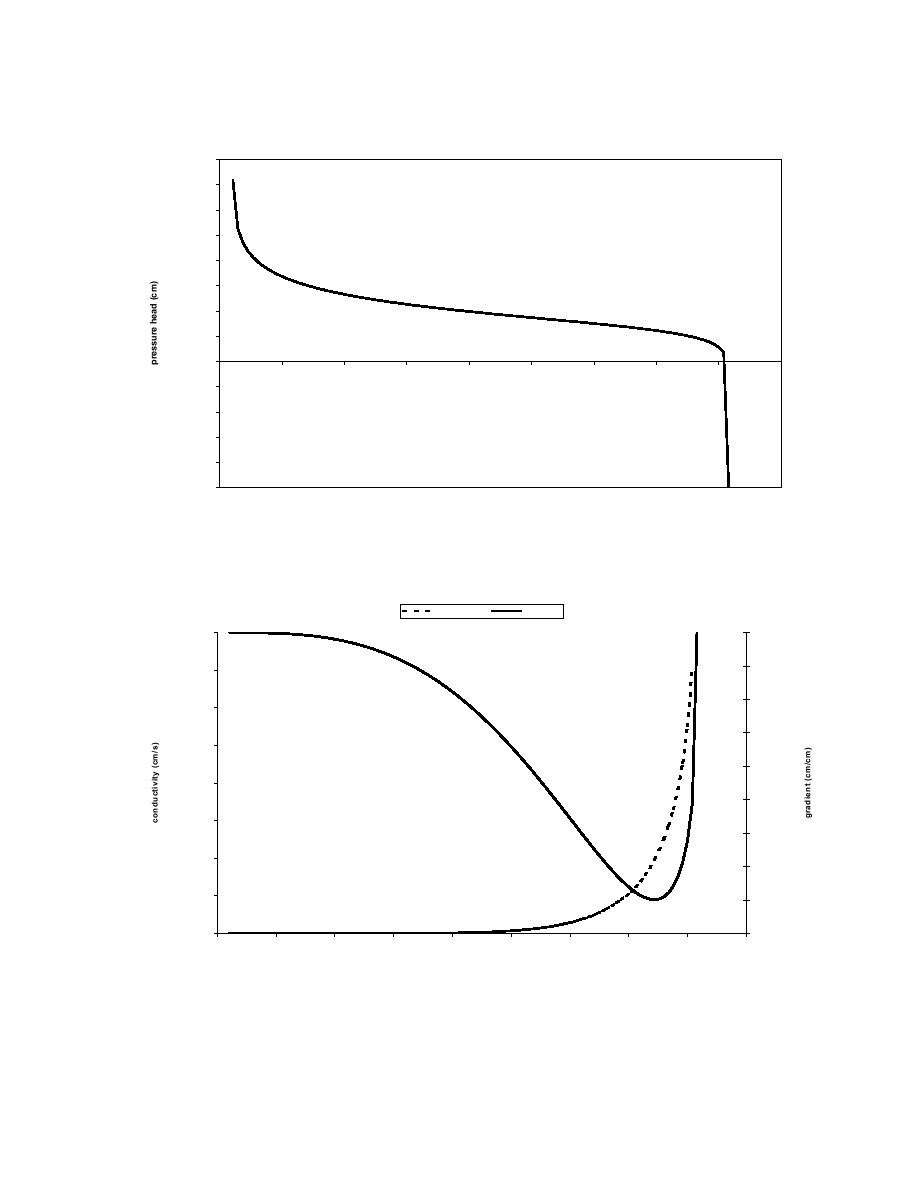
Figure 5.1 ψ versus θ for Yuma, AZ, sand.
Yum a, AZ sand
gradient
1.60E-04
0.00E+00
-5.00E-02
1.40E-04
-1.00E-01
1.20E-04
-1.50E-01
1.00E-04
-2.00E-01
8.00E-05
-2.50E-01
6.00E-05
-3.00E-01
4.00E-05
-3.50E-01
2.00E-05
-4.00E-01
0.00E+00
-4.50E-01
0
0.05
0.1
0.15
0.2
0.25
0.3
0.35
0.4
0.45
soil m oisture
Figure 5.2 K versus θ and ∂θ/∂ψ versus θ for Yuma, AZ, sand.
The hydraulic conductivity also depends on the volumetric moisture content such that
(van Genuchten 1980)
47


 Previous Page
