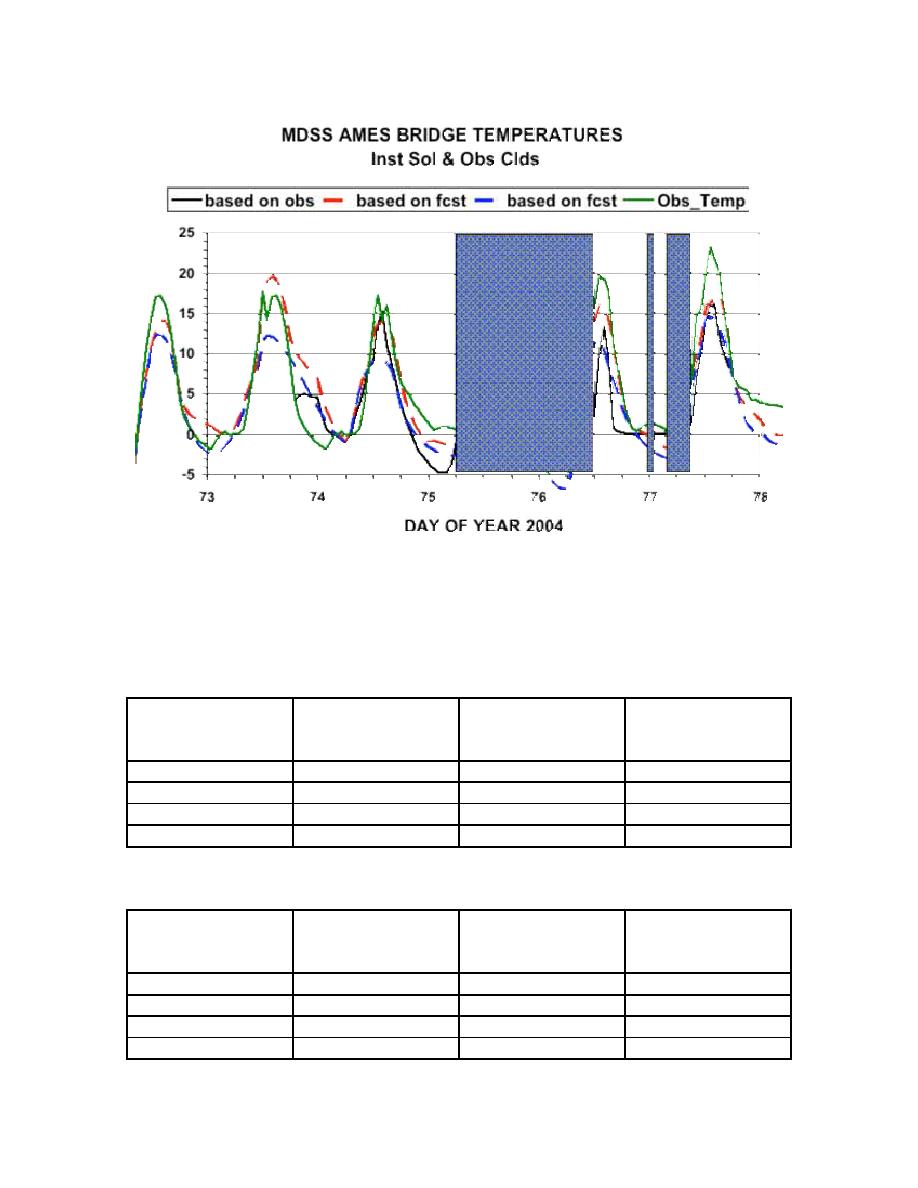
Fig. 12.8. SNTHERM-RT predicted bridge surface temperature using the instantaneous
solar flux, observed meteorological conditions, and the observed cloud conditions. Also
plotted is the maximum and minimum predicted road surface temperatures based on the
ensemble forecast model meteorological conditions.
Table 12.2. RMSE (degree centigrade) for the reanalysis of the Iowa MDSS road surface
temperatures. See text for explanation.
Fcst Meteorology
Fcst Meteorology
Weather
Minimum road temp
Maximum road
Observations
temp
Avg solar Fcst clds
3.8/3.6
2.8/3.2
4.2/3.0
Avg solar Obs clds
3.8/3.6
2.8/3.2
3.8/3.3
Inst solar Fcst clds
3.8/3.6
2.8/3.2
4.4/3.1
Inst solar Obs clds
3.8/3.6
2.8/3.2
4.2/3.4
Table 12.3. RMSE (degree centigrade) for the reanalysis of the Iowa MDSS bridge
surface temperatures. See text for explanation of the scenarios.
Fcst Meteorology
Fcst Meteorology
Weather
Minimum road temp
Maximum road
Observations
temp
Avg solar Fcst clds
4.4/3.2
3.4/3.7
4.2/3.8
Avg solar Obs clds
4.4/3.2
3.4/3.7
4.7/3.7
Inst solar Fcst clds
4.4/3.2
3.4/3.7
5.3/3.3
Inst solar Obs clds
4.4/3.2
3.4/3.7
5.1/3.8
150


 Previous Page
