the road. When the snow does finally melt, the predicted road surface temperatures start
to increase, but lag behind the observed road surface temperatures. In the model runs
using the ensemble forecast information, the snow had been artificially removed from the
road the solar flux heated the road and the predicted road surface temperatures mimic the
observed road surface temperatures.
MDSS Ames Road Temperatures
Average Solar & Forecast Clouds
Based on obs
Based on Fcst
Based on Fcst
14
12
10
8
6
4
2
0
73
74
75
76
77
78
Day Of Year 2004
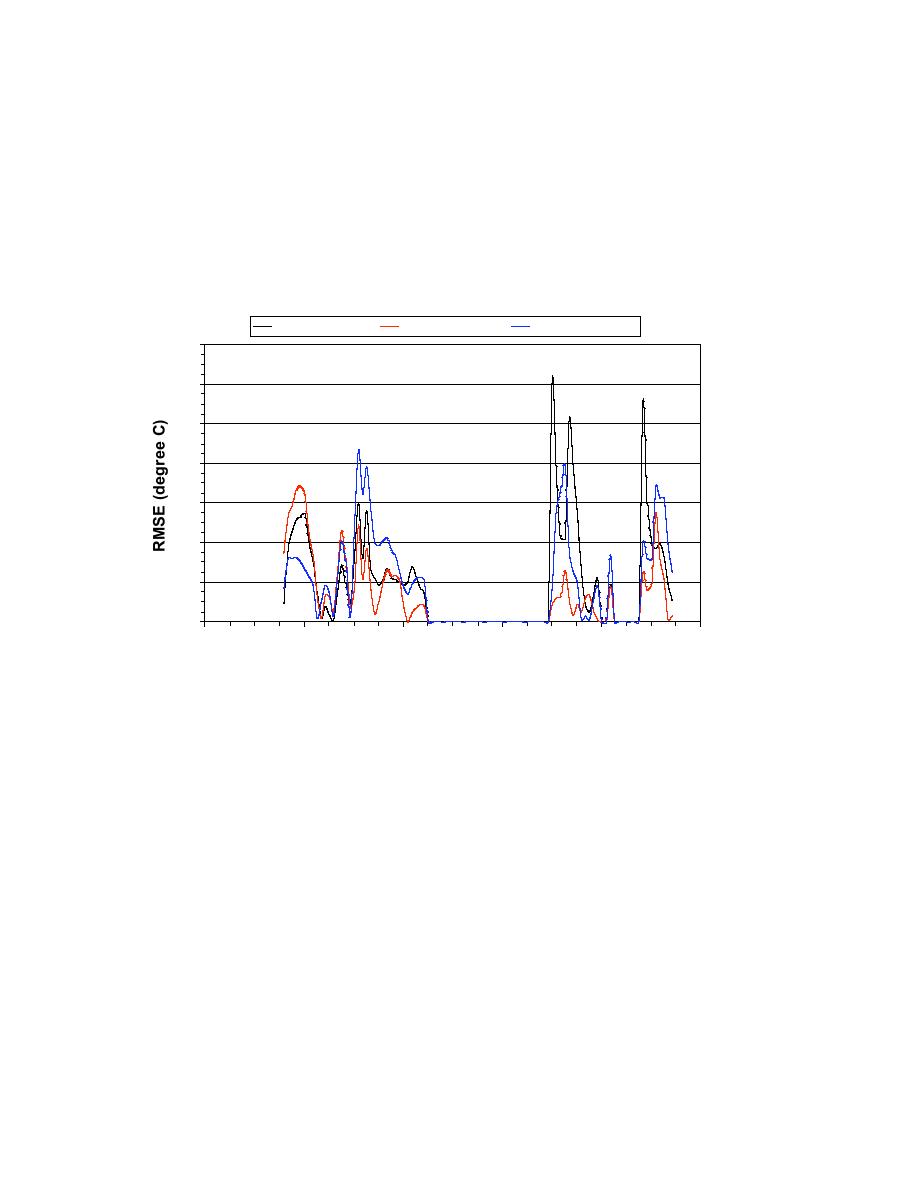
Fig. 12.5. Root Mean Square Error (RMSE) for SNTHERM-RT road surface temperature
predictions based on the observed weather conditions, average solar flux, and ensemble
forecast model clouds (black line) and the maximum (red line) and minimum (blue line)
predicted road surface temperatures based on the ensemble forecast model
meteorological conditions.
Fig. 12.6 is the same as Fig. 12.4 except the observed cloud conditions are used rather
than the ensemble forecast model cloud conditions. The predicted snow cover on the road
surface at the beginning of DOY 77 predicted by SNTHERM-RT based on the
precipitation and the ensemble forecast model cloud amounts does not agree when
SNTHERM_RT predicted snow cover based on the observed cloud conditions, even
though the same precipitation information is used in both SNTHERM-RT model runs.
SNTHERM-RT was also run for the following cases; instantaneous solar flux and
forecast cloud conditions, and instantaneous solar and observed cloud conditions. All
reanalysis model runs were repeated for the bridge north of the Ames garage. Figs. 12.6
and 12.7 present the results using the instantaneous solar flux and the ensemble forecast
and observed cloud conditions. Finally, we summarize the results by presenting the Root
Mean Square Error (RMSE) for the different scenarios for both the road and the bridge in
147


 Previous Page
