

18 UTC on 9 February, about 9 hours before the snow event occurred, and the second run
is from 06 UTC on 11 February.
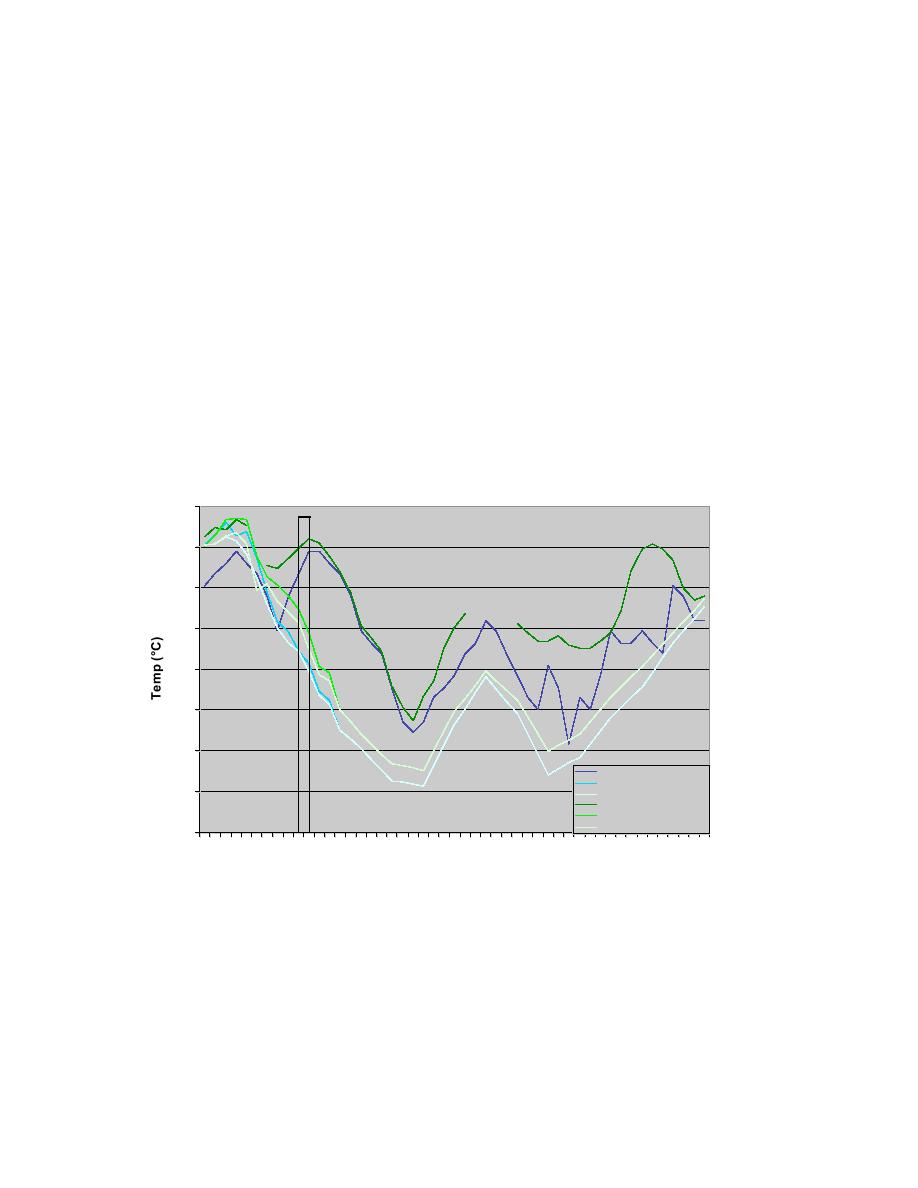
Air temperature forecasts from the 18 UTC, 9 February run started out matching the
RWIS observations quite well, but an hour or two before the light snow fell, the
observations actually rose while the forecasts kept declining (Fig. 10.28). This suggests
that there was a push of warmer air just prior to the cold front moving through the area.
This is a difficult thing to forecast and the RWFS temperature forecast never recovered
through the rest of the time series. The forecast was as much as 6C off at times, with an
average error of about 3C. Another possible reason for the poor air temperature
forecasts is a poor cloud cover forecast (Fig. 10.29). The forecast and observed air
temperatures really start to diverge during the hours just after sunset, when the RWFS
under-predicted the cloud cover. This should have resulted in an over-prediction of
surface cooling. Forecasts for the next day had overpredictions of cloud cover during
daylight hours, so the air temperature was held down further because of a thicker cloud
cover compared to reality.
Air Temperature Comparison for Feb 9, 2004
0
AMW
-2
-4
-6
-8
-10
-12
AMW METAR OB
AMW METAR wFSL
-14
AMW METAR woFSL
AMW RWIS OB
AMW RWIS wFSL
AMW RWIS woFSL
-16
18 20 22 0 2 4 6 8 10 12 14 16 18 20 22 0 2 4 6 8 10 12 14 16 18
Time (UTC)
Feb 10, 2004
Feb 11, 2004
Fig. 10.28. Air Temperature (C) time-series plot comparing the Ames
METAR and Ames RWIS observations to the RWFS forecasts (both with
and without the FSL supplemental models) for the METAR and RWIS site.
The vertical lines represent the time period that the Ames METAR was
reporting falling precipitation.
56

 Previous Page
