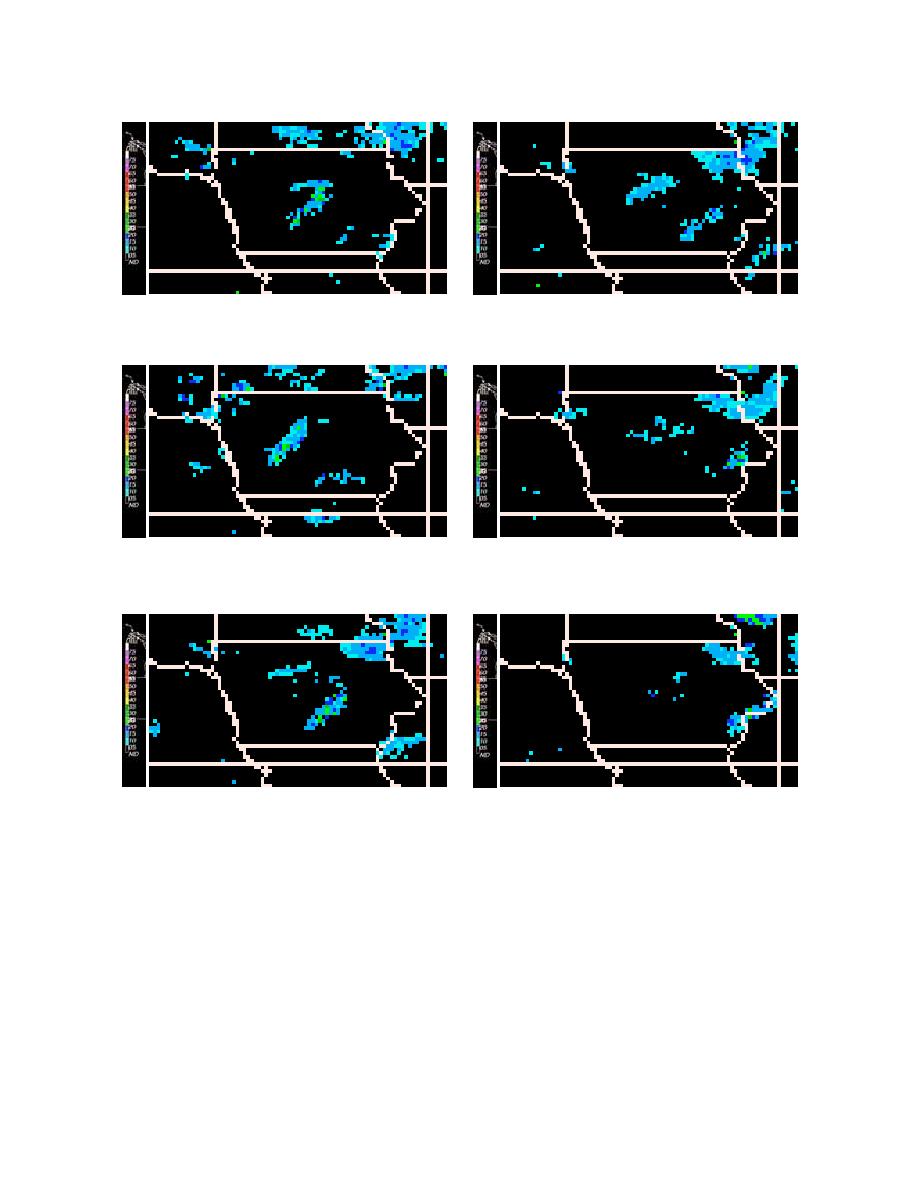
Fig. 10.27a
Fig. 10.27d
Fig. 10.27b
Fig. 10.27e
Fig. 10.27c
Fig. 10.27f
Fig. 10.27. Radar images showing the progression of the precipitation; a)
02 UTC 10 February 2004 b) 03 UTC 20 February 2004 c) 04 UTC 10
February 2004 d) 05 UTC 10 February 2004 e) 06 UTC 10 February
2004 f) 07 UTC 10 February 2004.
For this case two runs from the RWFS were examined, one to look at the prediction of
precipitation start and stop times for the very light snowfall and the other to look at the
prediction of blowing snow alerts and treatment recommendations. The first run is from
55


 Previous Page
