(m)
(ft)
0.8
2.4
2.0
0.6
1.6
0.4
1.2
0.8
0.2
0.4
0
0
1000
2000
3000 (ft)
0
200
400
600
800
100
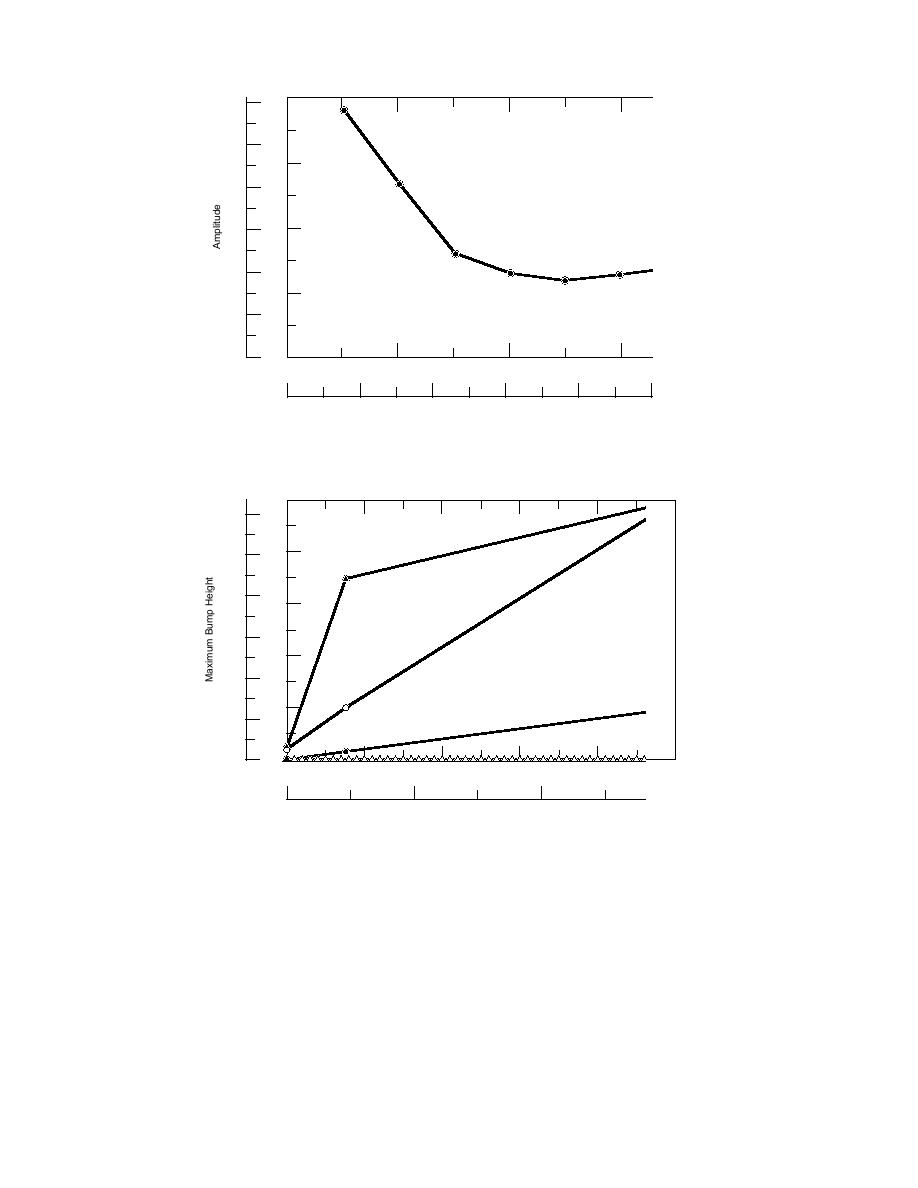
Figure 63. Cosine bump analysis results for finish-graded runway.
(mm)
(in.)
50
1200
40
Unprepared
1000
800
30
Semi-improved
600
20
400
10
Paved
200
Pegasus
0
0
200
400
600
800
0
100
200
Figure 64. Bump analysis results for finish-graded ice compared to military specifi-
cations for allowable bumps on runways.
by the aura of being "first." By contrast, some
FLIGHT TEST
groups may be overly cautious and very reluctant
A flight test is the only remaining step in certi-
to try a new ice runway. We found that it was
fication of the runway for full operations. Pilots,
beneficial to include in the progress reports and
flight operations managers, and facility operators
briefings about the runway construction and cer-
often fall into either one of two minds when it
tification, from a very early date, all parties asso-
comes to the first landing on a new airfield. Most
ciated with flight operations. Encouraging visits
pilots are optimistic and eager, being captivated
to the runway and visual inspection of the run-
61


 Previous Page
