

Table 3. Intermediate-velocity impact test data.
Sample ID
Pressure (psi)
Corrected velocity (m/s)*
Energy (J)
Polycarbonate Samples
PC 1
22.8
141.1
141.4
PC 2
34.6
171.5
208.7
PC 3
49.3
197.2
276.0
PC 4
82.4
234.5
390.4
PC 5
114.8
274.0
533.0
PVC Samples (Control)
PVC 7
82.5
234.6
390.8
PVC 8
50.9
209.6
311.9
122.8
PVC 9
17.5
107.1
PVC 10
13.2
101.6
73.3
PVC Samples (20-hr exposure)
PVC 17
10.7
92.2
60.4
123.8
PVC 19
17.4
108.8
PVC 20
15.0
113.4
91.3
PVC Samples (200-hr exposure)
PVC 27
11.7
81.2
46.8
PVC 28
13.4
105.8
79.5
130.8
PVC 29
17.3
121.5
*Bold type indicates ballistic limit.
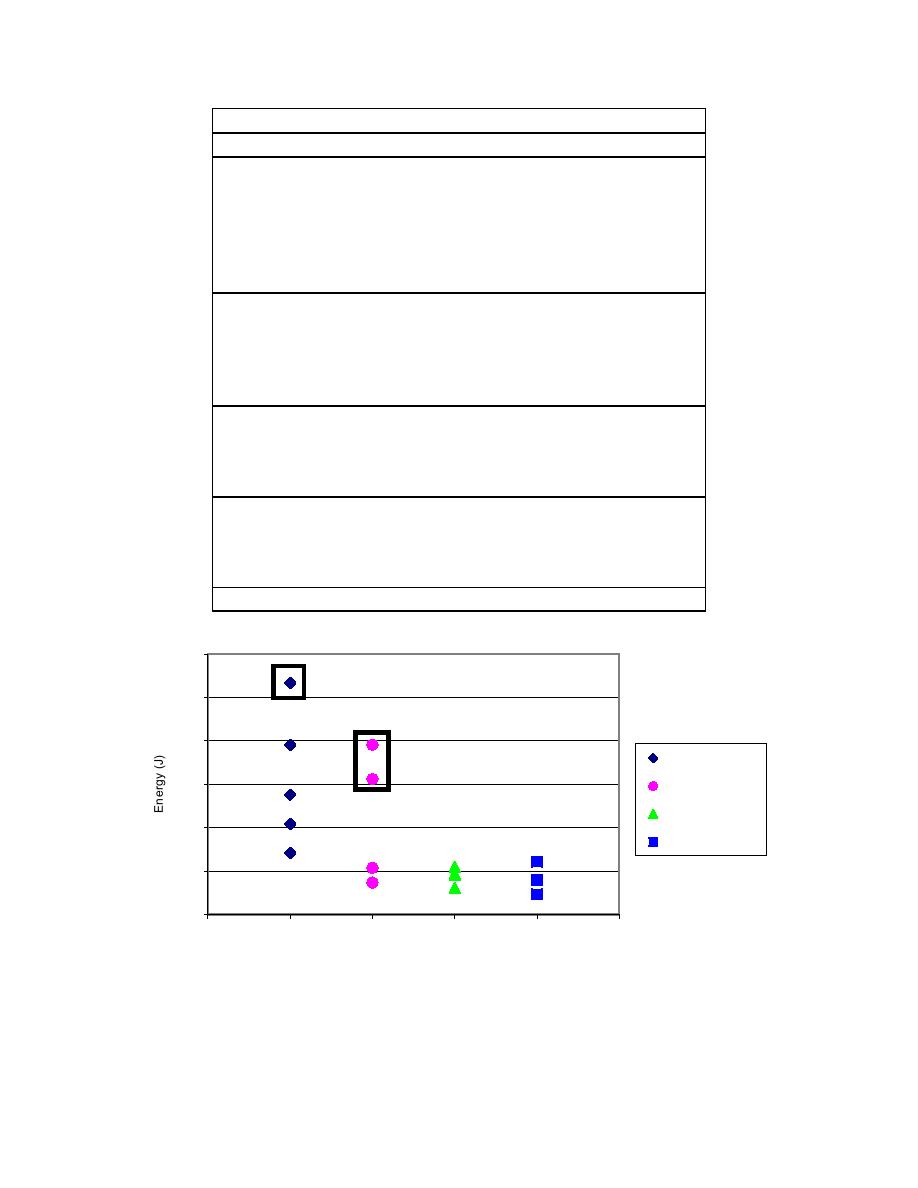
600
Penetration
500
400
Extensive
PC
Damage
300
PVC Control
PVC 20 Hrs UV
200
PVC 200 Hrs UV
100
0
0
1
2
3
4
5
Specimen
Figure 32. Intermediate-velocity impact results for the PVC control, PVC 20-hour, PVC
200-hour, and the PC samples.
29

 Previous Page
