Izod test
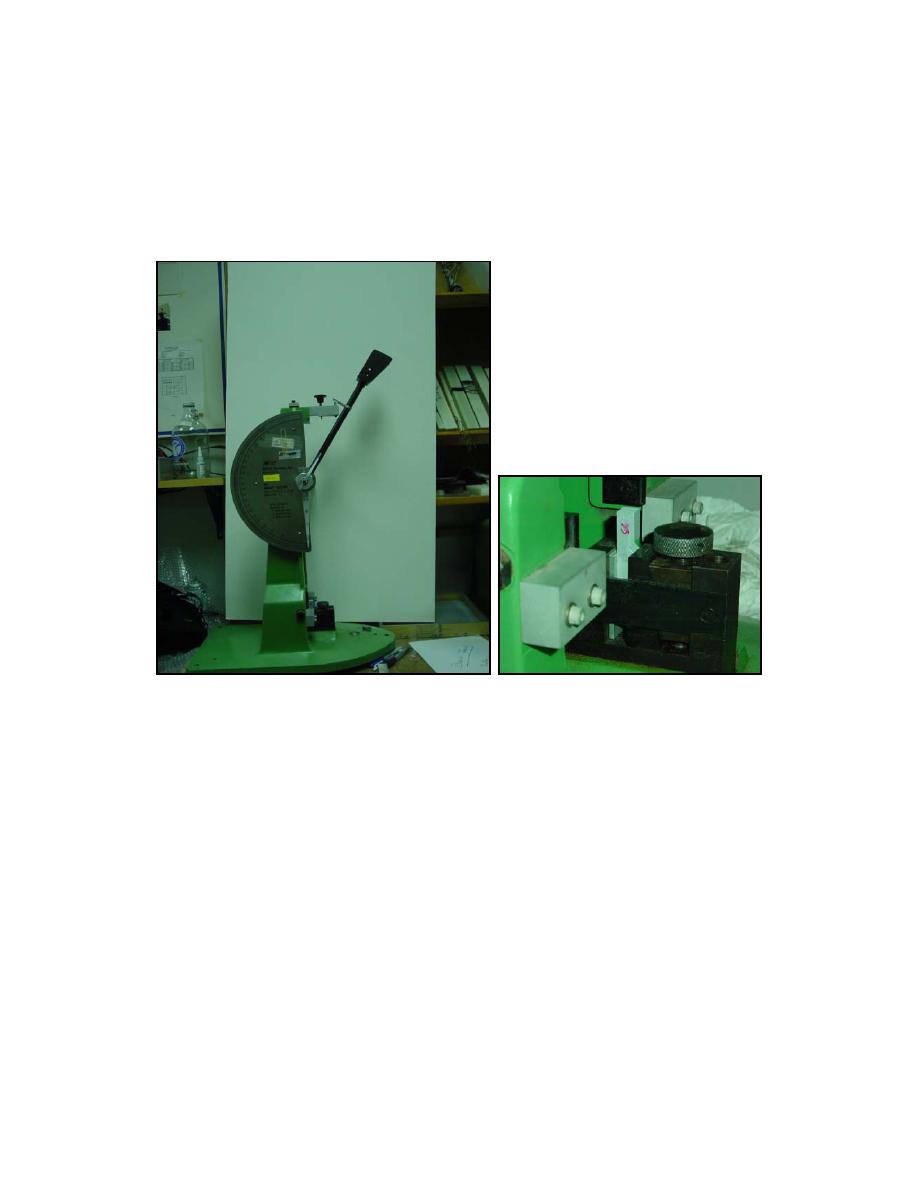
Figure 40 shows the Izod testing machine with a sample placed in the anvil. The Izod impact
pendulum hammer in its swing hits the vertically held sample on the notch side and initiates the
fracture at the notch root. The top part of the sample breaks off, allowing the hammer to continue
to swing to a height that indicates the energy expended in fracturing the PVC material. The
energy, of course, depends on the material's impact resistance to fracture.
Figure 40. Izod testing machine with the samples shown in the anvil in the inset.
Results
The results of the Izod impact tests are given Table 3. These results are also shown
graphically in Figure 41a and b; in the later the x-axis is a log scale. The trend line shows that a
relationship between the impact resistance R and the time t of UV exposure can be established as
the following simple empirical equation:
R = At β
where A and β are the two constants for the material and the geometry of the test samples, which
can be determined by performing a series of Izod tests. In the current test series the values of A
and β are 0.3651 and 0.0183, respectively. This example shows that by using this method the
impact resistance R after a hypothetical continuous exposure of 50 years (438,000 hours) can be
predicted to be 0.288, as shown in Figure 42. The results show the same trend of impact
resistance degradation as observed by Rabinovitch et al. (1993a and 1993b).
33


 Previous Page
