6
5
PVC Control
4
PVC 20h
3
PVC 200h
2
PC
1
0
0
1
2
3
4
5
Specimen
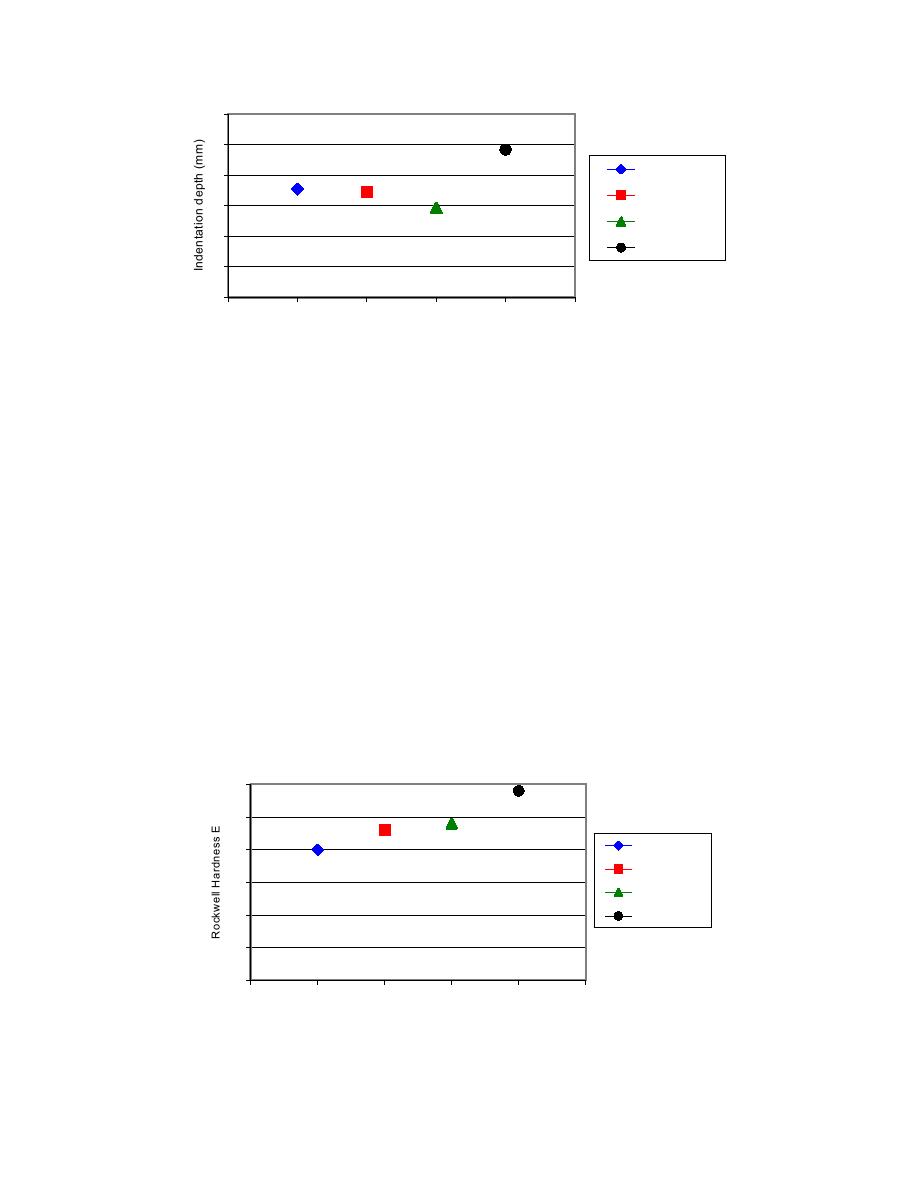
Figure 27. Indentation depth for the PVC control, PVC 20-hour, PVC 200-
hour, and PC specimens.
Figure 27 shows the absolute values of the indentation depth on the y-scale. The 200-hour
exposed samples appear to have a brownish "skin" limited to a few microns from the surface.
This leads to an increase in surface hardness and reduces the indentation depth compared to the
control. The PC underwent the highest depth of penetration. Notably, no radial cracking was
observed in the case of the PVC samples (both for control and exposed). For the PC sample, some
radial tensile side cracks were observed.
Hardness test
A Rockwell testing machine (ASTM D 78589) was used for the comparison of hardness
between the PVC control, PVC 20-hour UV exposed, PVC 200-hour UV exposed, and PC
samples. Figure 28 indicates the Rockwell Hardness E (RHE). The ASTM RHE test utilizes a
1/8-in. indentor with a 100-kg major load and a 10-kg minor load for each specimen.
The indentation trends observed for LVI correspond well with the RHE, i.e. the PVC 200-
hour exposed samples show slightly higher RHE, because of the surface skin embrittlement,
while the control samples show a lower value. (Note: The PC shows a higher RHE, although it
shows the highest indentation; this is because of the strain rate sensitivity for PC.)
30
25
PVC Control
20
PVC 20h
15
PVC 200h
10
PC
5
0
0
1
2
3
4
5
Specimen
Figure 28. Rockwell Hardness E for the PVC control, PVC 20-hour,
PVC 200-hour, and PC specimens (average of five measurements).
27


 Previous Page
