EAGLE RIVER FLATS FY 00
24
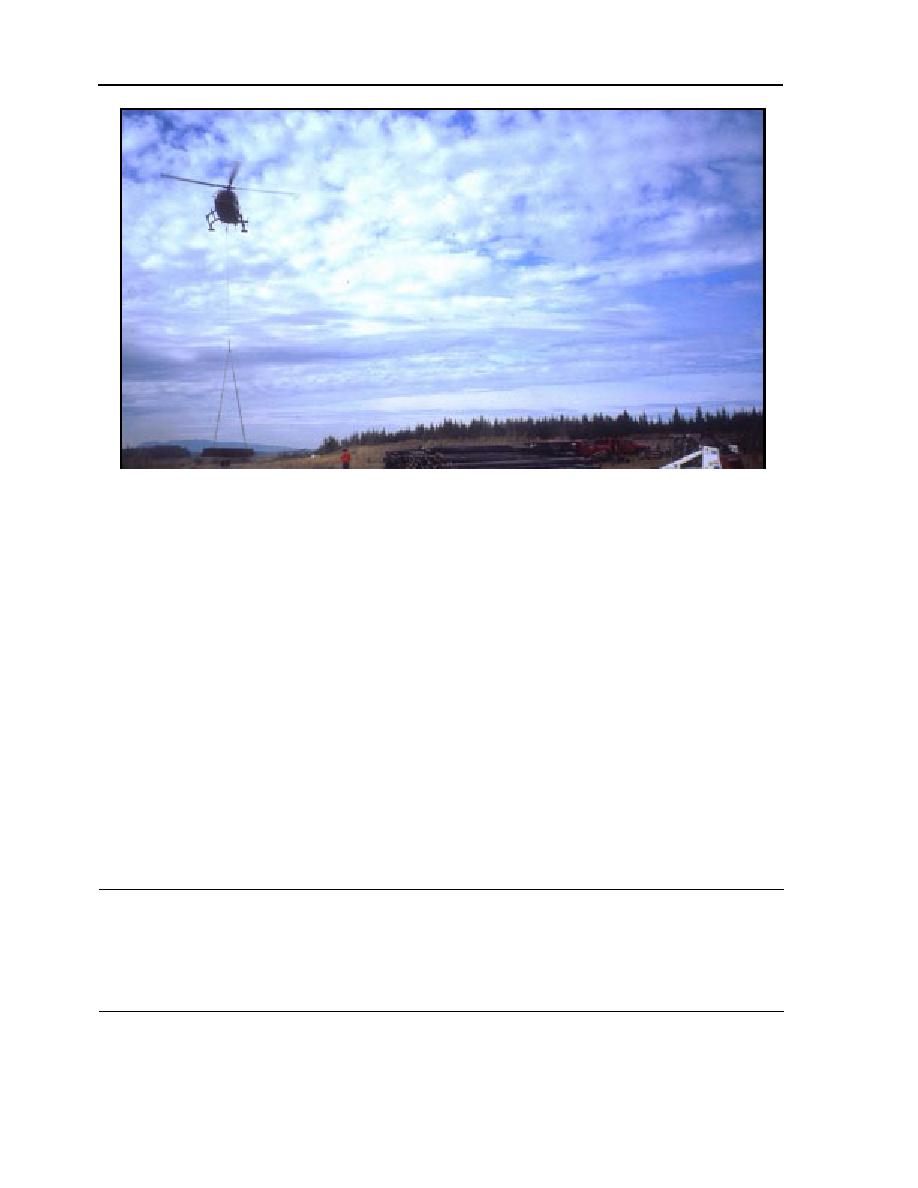
Figure III-1-3. Retrograde of pipe to EOD Pad using slings.
ran frequently, as predicted. Cycling of Sys-
tive of a shallow sump, which quickly fills and
tem 3 was reduced significantly because of the
is drained by the pump. Both sumps should
larger sump blown the previous fall. The re-
be further deepened to reduce cycling.
sults of enlarging the sump in Pond 730 are
not known because the genset installed there
the previous year (System 2) has no cycle
RETROGRADE
counter for the pump. Cycling in Ponds 256
Defueling of the systems in August was
and 730 is indicated by the high ratio of genset
planned to minimize the on-board fuel load
hours to pump hours, reflecting short pump
of the gensets. All field units except genset 6
times along with frequent warm-up and cool-
have a maximum fuel capacity of 250 L (15-
down cycles for these systems. This is indica-
Table III-1-3. Pump operation statistics for 1999 season.
System
System
Total
Total
Total
Pump-to-
Fuel
Est. Fuel
Start
Stop
Genset
Pump
Pump
Genset
Use
Use Rate
System
Date
Date
Hours
Hours
Cycles
Hrs Ratio
(Est)(L)
(L/hr)*
1
11 May
15 Aug
64
59
N/A
1.09
1290
20.2/21.9
2
11 May
16 Aug
154
126
N/A
1.22
2490
16.2/19.8
258
599
3
8 May
17 Aug
347
1.34
8610
24.8/33.4
137
160
4
11 May
16 Aug
399
272
935
1.47
5110
12.8/18.8
5
12 May
16 Aug
560
366
1747
1.53
6060
10.8/16.6
6
11 May
17 Aug
165
139
228
1.19
1890
11.5/13.6
Notes: *Fuel consumption rates: First number based on genset hours, second rate based on pump hours.
System 3 has two pumps, 63 L/H and 126 L/H. The 63-L/H pump always ran with the 126-L/H pump. The fuel use rate is based
on the hours of the 126-L/H pump. Fuel use estimates are based on Weldin and CRREL data. Other data provided by Dave
Mitchell and Terry Edwards of Weldin, Inc.


 Previous Page
