Ontario, and New Brunswick in Canada. The level of tree damage has been compared to the
1938 hurricane. Forestry organizations in New Hampshire, Maine, and Vermont have coordinat-
ed their aerial and ground surveys to map the extent and severity of damage to the national for-
ests, state forests, and privately owned woodlots and sugar bushes. They are compiling and orga-
nizing the information into a single database managed by the U.S. Forest Service, Northeastern
Area GIS Group in Durham, New Hampshire. In general, the greatest damage occurred to hard-
wood stands, while evergreen stands withstood the ice loading. The information on forest dam-
age that follows contains information and general observations from telephone and personal con-
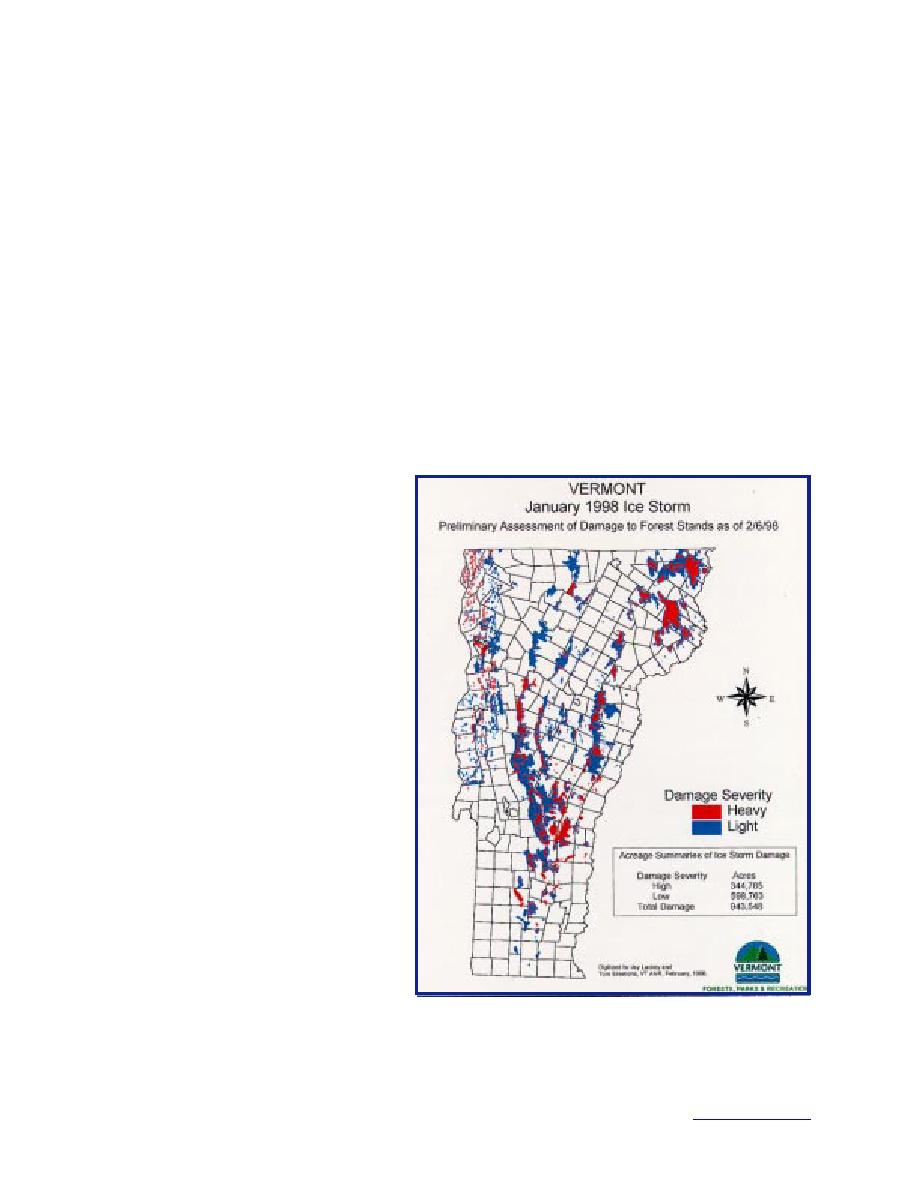
tacts that we made with these groups. We show in Fig. 11a, b, and c maps of forest damage in
Vermont (Vermont Department of Forest, Parks and Recreation unpublished), New Hampshire
(New Hampshire Division of Forests and Lands, Forest Health Protection Section and U.S.
Forest Service Northeast Area GIS Group unpublished), and Maine (Maine Forest Service un-
published). The mapped damage severity is based primarily on aerial surveys and will be re-
vised and refined using ground surveys that are now underway. Questions on the maps should be
addressed to the referenced agencies. To determine general trends in the forest damage, we also
compiled information obtained from hiking and snowmobile clubs, reports from trail users that
are posted at the clubs' Web sites, and
information from local residents.
In Vermont, an extensive forest dam-
age assessment was completed by the
Green Mountain National Forest (GMNF)
and the Vermont Department of Forest,
Parks and Recreation (VDFPR), who
compiled the damage information into
the map shown in Fig. 11a. Other sources
of forest damage information are the
Green Mountain Club, the Appalachian
Trail Conference, the Catamount Trail
Association, and the Vermont Area Snow
Travelers (VAST). Forest damage in Ver-
mont was spotty both in location and in
severity. Officials of the GMNF reported
that east-facing slopes and the tops of
ridges at elevations above 2000 ft gener-
ally suffered the worst damage, especial-
ly in its Rochester District, near the cen-
ter of the state. The general trend over
the entire state, according to VDFPR of-
ficials, is that the lighter damage began
at around 1300 ft and escalated to heavy
to severe damage starting at about the
1800-ft level, except around Lake Cham-
a. Vermont.
plain in the northwestern corner of the
Figure 11. Maps of damage to forests from the January
state. There, cold air at lower eleva-
1998 ice storm.
tions resulted in the heaviest ice loads
15
Back to contents page


 Previous Page
