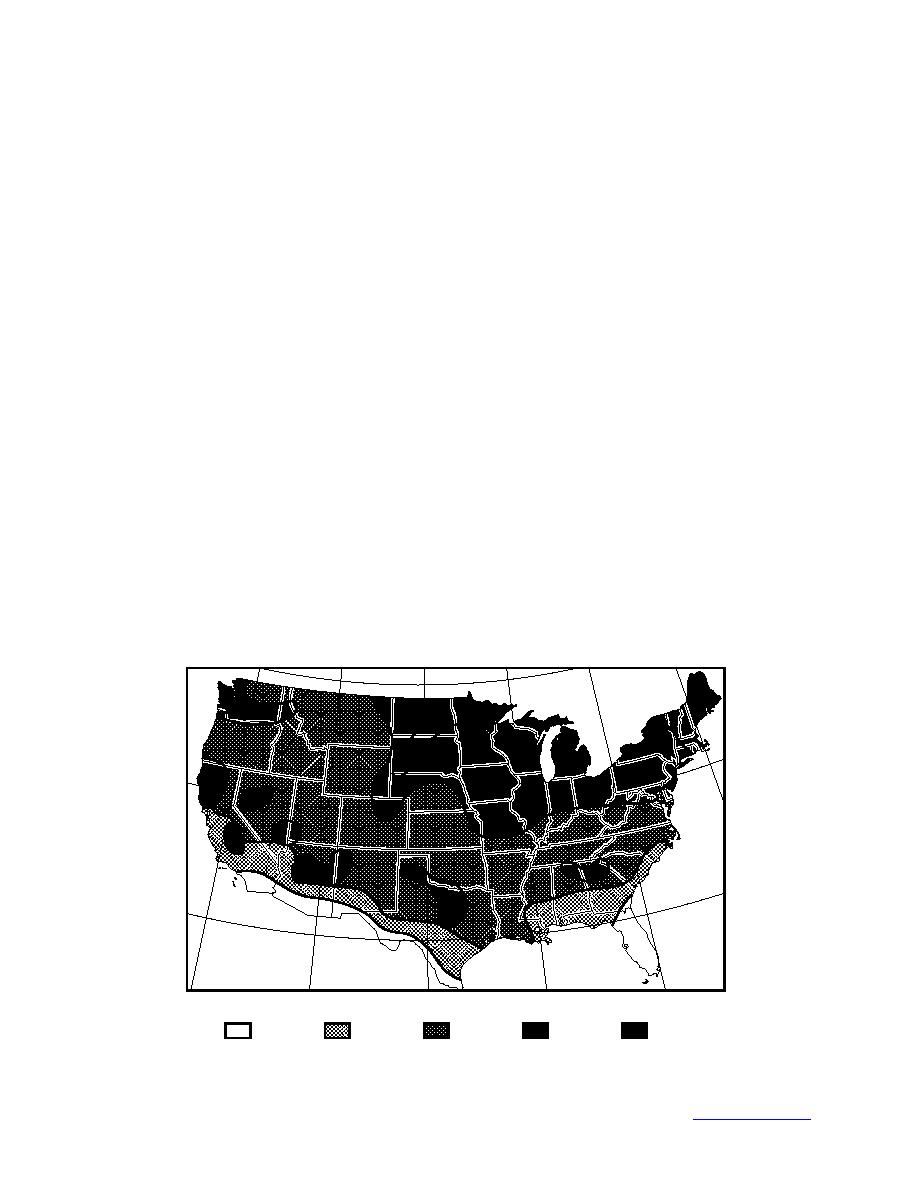
storm (Fig. 3). A wind speed of 40% of the 50-year return-period fastest-mile wind speed, from
ASCE Standard 7-88, is applied with this ice load.
EIA/TIA 222-F is the most recent revision of the standard for communication tower design.
It does not provide an ice-load map, but suggests that ice loads be considered in the design of
towers where ice accretion is known to occur. Typically 0.5-in. uniform ice thicknesses are
assumed. With this ice load a wind speed equal to 87% of the 50-year return-period fastest-mile
wind speed from ASCE Standard 7-88 is applied.
The ice-load map in ASCE 74 was developed from a map in a report written by Ivan Bennett in
1959. Bennett used ice thickness data measured by railroad personnel in a study conducted by the
Association of American Railroads (AAR) over a 9-year period from 1928 to 1937. He mapped the
maximum reported ice thickness in each square of a 60-mile by 60-mile grid laid over the United
States (Fig. 4). These thicknesses are probably the maximum ice thicknesses, rather than the equiva-
lent uniform thicknesses, but the report does not provide enough information to determine how the
loads were measured or reported. The original records from the AAR study are lost. Hoffmann (1984)
developed an ice load map, also based on the Bennett map (Fig. 5), that is significantly different from
the ASCE 74 map. These different expert interpretations result from the limited period of the AAR
study and the lack of information on the ice thickness measurements that Bennett used.
In 1973 Tattelman and Gringorten developed yet another ice-load map. They used the same
Bennett map, but extended the period of record from 9 years to 50 years by using ice thicknesses
reported in or estimated from descriptions of severe storms in Storm Data (NOAA 1959present)
and its predecessors. Storm Data is a National Oceanographic and Atmospheric Administration
(NOAA) publication that summarizes destructive weather-related occurrences, including freez-
ing-rain storms, hurricanes, lightning strikes, tornadoes, and blizzards. It has been published
monthly since 1959 and each monthly publication is ordered alphabetically by state. Shan and
120
110
100
90
80
70
40
40
30
30
120
110
100
90
80
Zone 1
Zone 2
Zone 3
Zone 4
Zone 5
0"
0.4"
1"
1.6"
2.2"
Figure 3. 50-year return-period ice-load map from ASCE 74 (1991).
4
Back to contents page


 Previous Page
