2,4-DNT, 97 g/kg for 2-ADNT, and 86 g/kg for
The frequency of detection of ERCs in the soils near
4-ADNT. Concentrations of TNT were generally less
PMA-1A mines remained similar to that found for
than 10 g/kg, while the sum of 2-ADNT and
samples collected in November 1998 (19 out 40, or
4-ADNT was often several times higher. The pattern of
48%). The frequency of detection in surface soils was
detection (Fig. 5a and b) is consistent with a discon-
7 for 20 or 35%. The most frequently detected analytes
tinuous halo caused by ERCs moving upward around
were 2-ADNT, 4-ADNT, 2,4-DNT, 2,4,6-TNT, 1,3-
the perimeter of the mine from a high concentration
DNB, and 3,5-DNT. In surface soils, 2-ADNT and
source under it. In this case, the concentration of
4-ADNT were the most frequently detected analytes
ERCs in the soil under the mine was in thousands
and those found at the highest concentration. The high-
of micrograms per kilogram. A heterogeneous pattern
est measured concentrations in surface soils were 357
g/kg for both 2-ADNT and 4-ADNT, 58 g/kg for
of signature detection was also found with the
2,4-DNT, and 12 g/kg for 2,4,6-TNT. The pattern of
sum of the ADNTs generally present at the highest
concentration (Fig. 5a and b). For one of these mines,
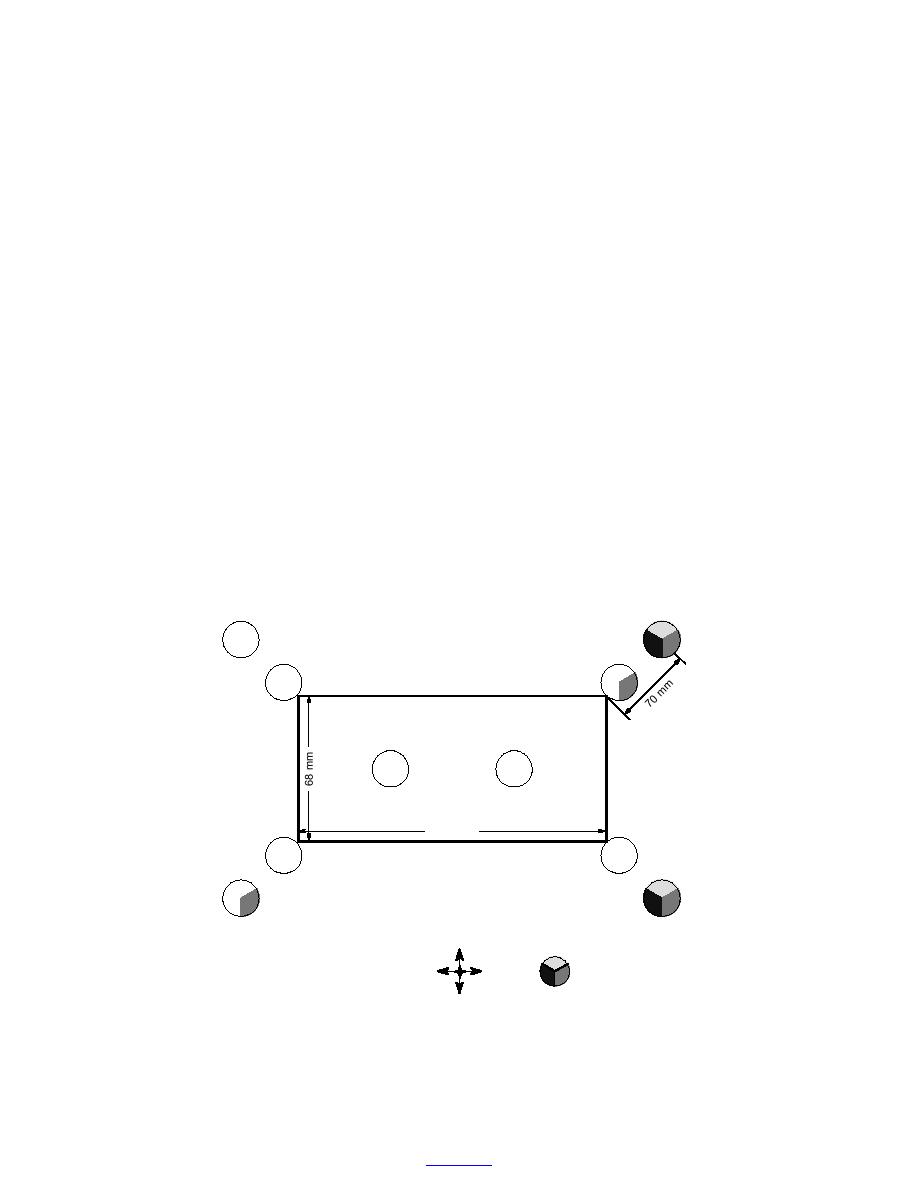
detection of ERCs in the surface soils near EX-020 and
there were low-level detections of ERCs over
EX-025 (Fig. 6) was around the perimeter of the mines,
the center of the mine, but even here, higher con-
with none detected in the surface samples collected
centrations were detected above the perimeter of the
directly over the mines.
mine.
For the PMA-2 mines, only 4 samples out of 40 had
Because the vapor pressures of 2-ADNT and 4-
detectable ERCs (two had 2,4-DNT, and two had 2,4,6-
ADNT are substantially lower than that of DNT, their
TNT). Only one of these samples was from the sur-
face; 2,4-DNT was detected at 17.8 g/kg in that
presence as major components of the ERCs may be dif-
ficult to use in a vapor-collection type of mine detec-
sample. Similarly, ERCs were only detected in 3 out of
tor. If, however, particles of surface soils, rather than
70 soil samples collected near the TMM-1 mines, and
vapor, were collected, and a device was engineered that
all three were soils collected next to the mines. In gen-
could release the signatures from these particles rap-
eral, ERCs do not appear to be accumulating near the
idly, the ADNTs would often be the major component
TMM-1 or PMA-2 mines at concentrations above ana-
lytical detection limits of about 1 g/kg.
of the ERCs available for detection.
6
3
4
236
Height= 31 mm
144 mm
9
3 82
160
N
DNT
PMA-1A (EX-020)
W
E
April 1999
TNT
Am-DNT
Surface Soil
S
Jenkins-018
a. EX-020.
Figure 6. Locations of various ERCs detected in surface soil near buried PMA-1A
land mines in April 1999.
20
to contents


 Previous Page
