Table 17. Frequency of detection of ERCs in soil samples collected near buried mines in November
1998.
Number of detections
Soil samples
Total soil samples (surface samples**)
Mine
type
Collected*
Analyzed
2,4-DNT
2,4,6-TNT
1,3-DNB
2-ADNT
4-ADNT
3-NA
PMA-1A
25
25 (10)
6 (2)
3 (0)
4 (1)
7 (3)
7 (3)
7 (4)
PMA-2
10
9 (4)
0 (0)
0 (0)
0 (0)
2 (1)
2 (1)
1 (1)
TMA-5
173
143 (31)
54 (10)
37 (7)
21 (2)
67 (15)
57 (12)
32 (5)
TMM-1
27
26 (9)
0 (0)
0 (0)
0 (0)
3 (2)
3 (2)
3 (2)
*Numbers inside parenthesis in the Soil samples column refer to the number of surface soil samples that were collected
for a given mine type.
**Numbers inside parenthesis in the Number of detections columns refer to the number of surface soil samples in which
ERCs were detected for a given mine type.
soils near TMA-5 mine EX-268, which was extensively
the ERCs in the soil surrounding this buried mine. It
sampled. Clearly, it is 2,4-DNT and the transformation
also revealed the large concentrations of ERCs present
products of TNT that have accumulated near the sur-
under the mine. This led to a hypothesis that ERCs were
face, rather than 2,4,6-TNT. Except for one sample,
being washed from the contaminated mine surface and
concentrations were less than 53 g/kg and generally
deposited in soils under the mine. It is well known that
less than 20 g/kg.
water flows around impenetrable objects and collects
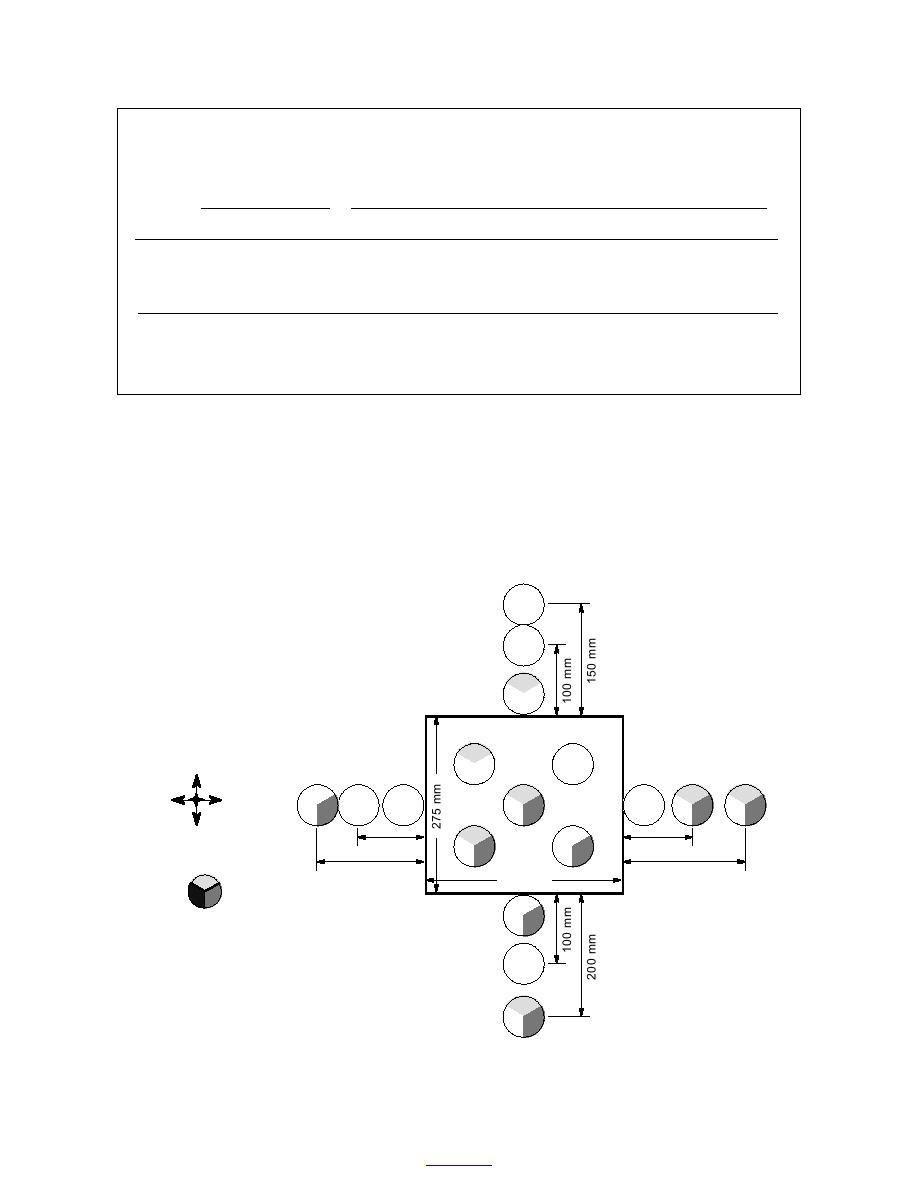
Analysis of the 93 soil samples collected near TMA-
under them; this is the same mechanism that is associ-
5 mine EX-268 confirmed the heterogeneous nature of
ated with frost heave.
20
TMA-5 (EX-268)
November 1998
Height= 113 mm
Surface Soil
T
N
27
10
W
E
63
T
13
S
T
90 mm
100 mm
21
9
DNT
140 mm
200 mm
312 mm
TNT
Am-DNT
17
1610
41
Jenkins-015
Figure 4. Locations of various ERCs detected in surface soil near buried TMA-5 land
mine EX-268 in November 1998 (T = trace).
17
to contents


 Previous Page
