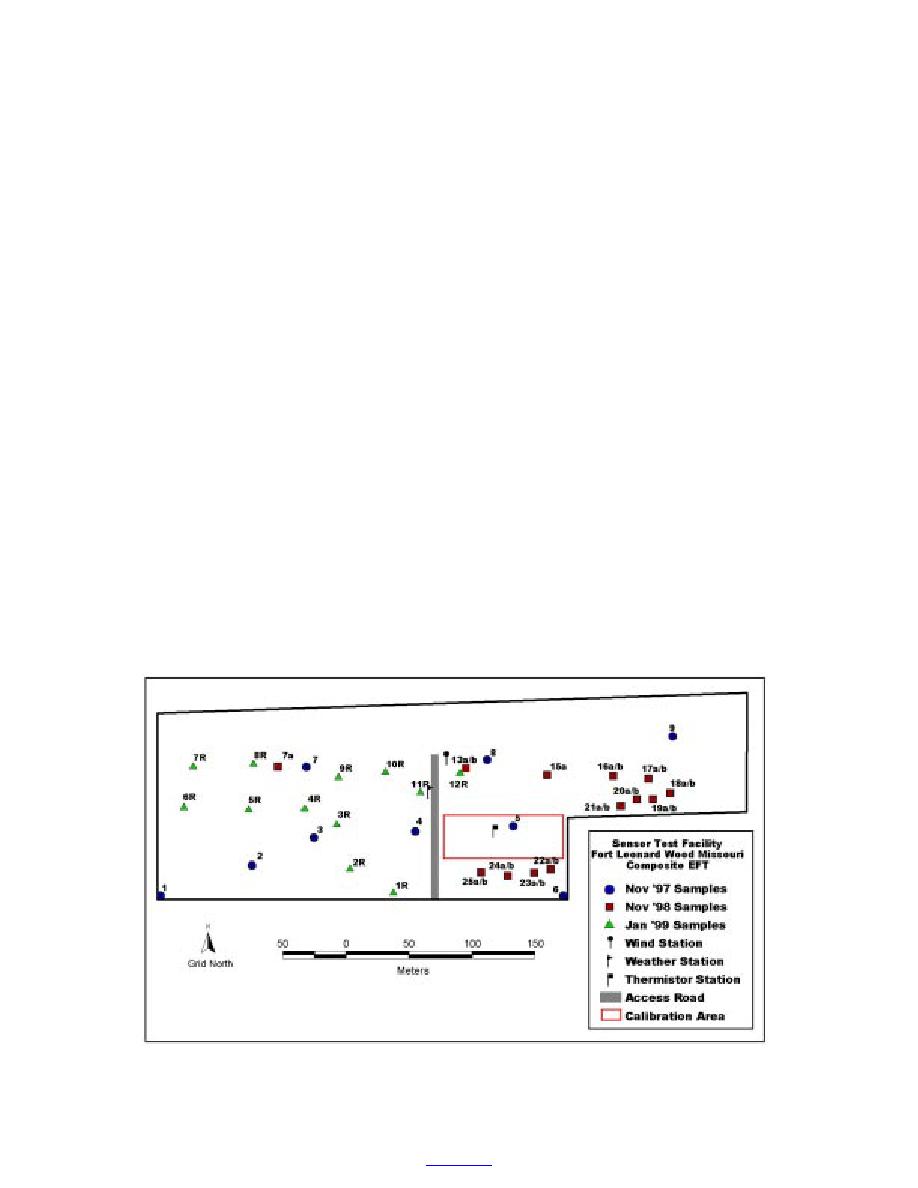
collected during the third sampling event (designated
the methods of Rhoades (1982). The pH was determined
with numerals followed by R to indicate repetition of
with a pH electrode on a 1:1 soil-to-water slurry.
previously sampled locations) (Fig. 2). The third sam-
Exchangeable iron was determined by using 1N
pling event was conducted because an ice chest of
ammonium acetate according to the methods of Olson
samples from the second sampling event was lost in
and Ellis (1982). TKN was determined according to
shipping. Samples lost included samples 16 a and b, 7
the methods of Bremner and Mulvaney (1982). Par-
a, 812 a and b, 14 a and b, and 15 b. For the third
ticle size distribution was determined by two methods:
sampling event, no depth distinctions were made.
hydrometer (Day 1956, as modified by Patrick 1958,
Samples were packaged in plastic baggies and shipped
Day 1965, ASTM 1985), and standard sieve analysis,
on ice to ERDC-EL. There, they were air dried, ground,
followed by classification according to the Unified Soil
and run through a 2-mm sieve to remove pebbles. Each
Classification System (U.S. Army Corps of Engineers
sample was thoroughly mixed and refrigerated until it
1960), and the USDA classification system (Gee and
was tested.
Bauder 1986). The hydrometer method classifies the finer
Only soils from the first sampling event were char-
particles, while the sieve analysis characterizes larger-
acterized for physical parameters plus total organic car-
sized particles.
bon (TOC), total Kjeldahl nitrogen (TKN), cation
Three samples from the first sampling event, five
exchange capacity (CEC), and pH; sample quantity was
from the second, and five from the third were used in
insufficient in the second and third sampling events.
partitioning tests to obtain estimates of the soil/water
partition coefficients (Kd). Subsamples of the 13 soils
However, notes were recorded from visual inspection
(2 g each) were mixed with 8 mL of a stock solution
of each sample. Soil moisture holding capacity or field
containing the following five concentrations of both
capacity was determined using methods described in
TNT and 2,4-DNT: 1.5, 1.25, 1.00, 0.75, and 0.50 mg/L.
Klute (1986). Field capacity is the amount of water the
Soils were shaken for 24 hours, centrifuged, and the
soil will hold after being saturated and allowed to drain
solution phase was analyzed as described below. When
under the tension of the dry soil below. It is measured
transformation products of TNT or 2,4-DNT were
at 1/3 bar. TOC was determined by wet combustion
detected, their concentrations were added to parent com-
(Nelson and Sommers 1982). CEC was determined by
Figure 2. Location of soil samples for physical characterization at Fort Leonard Wood, Missouri.
7
to contents


 Previous Page
