10
Predicted
Empirical
8
σ = 750 kPa
6
1.0 MPa
4
2
2
4
6
8
10
Vo (cm . d1)
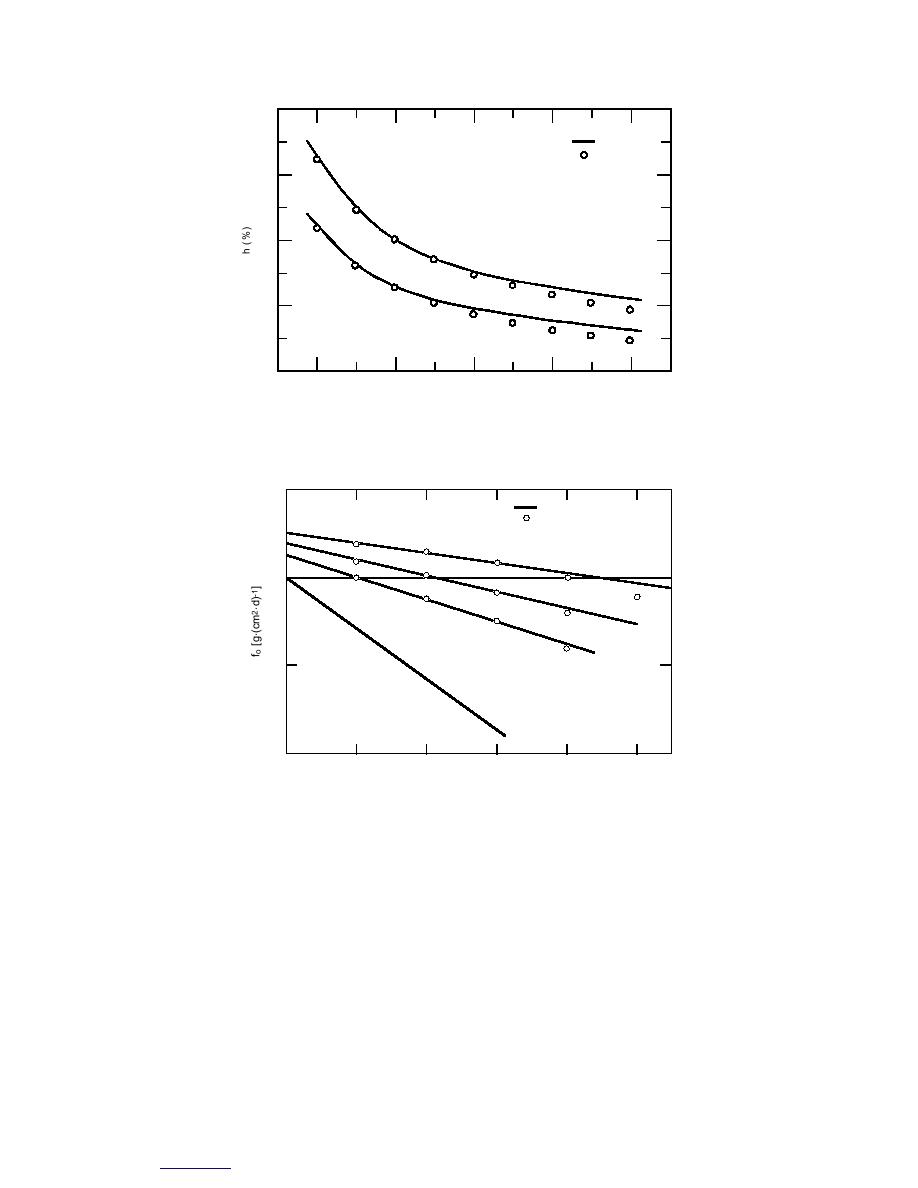
Figure 6. Calculated values of h (%) vs. Vo (cm/d) with αo = 0.75C/cm,
δo = 1.0 cm, σ = 0.75, and 1.0 MPa. Circles are calculated by an empiri-
cal formula (Ryokai 1985).
0.2
Predicted
Empirical
σ = 0.75 MPa
0.0
1.0
1.5
0.2
∞
0.4
0
2
4
6
8
10
.d-1)
Vo (cm
Figure 7. Calculated values of fo [g/(cm2 ⋅ d)] vs. Vo (cm/d) with αo =
0.75C/cm and δo = 1.0 cm and σ = 0.75, 1.0, 1.5 MPa, and ∞. Circles
are calculated by an empirical formula (Ryokai 1985).
significant and that the calculated curves with αo = 0.75C/cm agree well with the empiri-
cal formulas.
Assuming that αo = 0.75C/cm and δo = 1.0 cm, we calculated y, h and hw as functions of
Vo with σ = 0.75 and 1.0 MPa. In Figure 6 predicted curves of h vs. Vo with σ = 0.75 and 1.0
MPa are presented. From this figure we find that the predicted curves of h vs. Vo tend to
deviate from the empirical formulas when Vo > 6.0 cm/d. The calculated values of fo vs. Vo
are presented in Figure 7 when αo = 0.75C/cm, δo = 1.0 cm, and σ = 0.75, 1.0, 1.5 MPa and
∞. Circles in the figure are values calculated by the empirical formula. The values of Vo at fo
= 0 are 8.94 (7.77) cm/d, 4.19 (4.31), and 2.01 (1.88) for σ = 0.75, 1.0 and 1.5 MPa, respec-
tively, where numbers in parentheses are calculated by the empirical formula. The agree-
ment between the predicted and empirical values of Vo at fo = 0 is satisfactory.
30
to Contents


 Previous Page
