Estimated
10
Daily Value
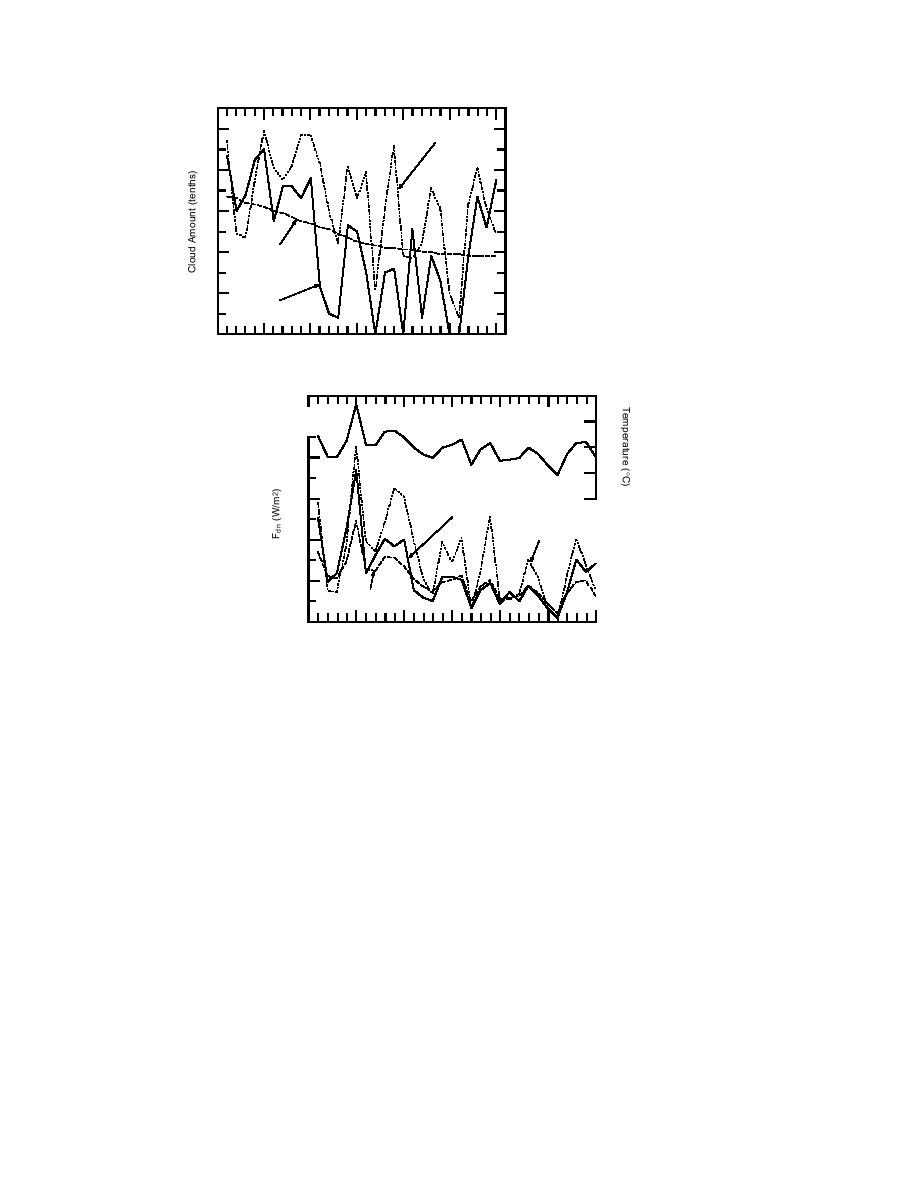
Figure 11. Temporal variability of
total cloud amount for November
8
1982 on North Pole 25. The traces
show 1) the 3-hour cloud obser-
6
vations averaged to daily values,
2) cloud amount estimates based
Monthly,
4
on eq 4 using daily averaged tem-
Interpolated
perature, and 3) cloud amounts
2
estimated using monthly cloud
Daily Averaged
data interpolated to daily values
0
using a parabolic interpolation
5
10
15
20
25
30
over three months.
November 1982
20
25
30
220
35
40
200
Daily
Averaged
Estimated
Daily Value
180
160
Monthly,
Interpolated
140
5
10
15
20
25
30
November 1982
Figure 12. Temporal variability of the daily averaged surface-
layer air temperature and the incoming longwave radiation
for November 1982 on North Pole 25. The computed values
of Fdn are based on eq 12 using 1) 3-hour cloud observations
averaged to daily values, 2) monthly cloud data interpolated
to daily values with a parabolic interpolation over three
months, and 3) daily averaged cloud data estimated using eq 4.
culations of longwave radiation for each winter month on North Pole 25 based on
the KL&A parameterization, explains the good agreement among these three cases.
We see in Table 10 and in Figure 12 that, despite the essential differences in the
time series of cloud amounts used in the calculations (Fig. 11), the time series of
calculated Fdn values correspond well with each other, both on average and in terms
of the linear correlation coefficient. Although this good agreement may, at first,
seem paradoxical, the formula used to estimate Fdn explains it. To obtain the
longwave fluxes in Table 10 and in Figures 12, we used--from eq 6 and 12--
(
)
Fdn = σ T 4 aK + bK n3 .
(16)
Thus, the air temperature T dominates the calculation. But remember, the correla-
tion between T and n is also high. Consequently, because the surface-layer air tem-
22


 Previous Page
