1250
1200
(a)
1150
1100
1350
1300
(b)
1250
1200
26 May
15 Jun
5 Jul
25 Jul
14 Aug
3 Sep
23 Sep
Period of Test
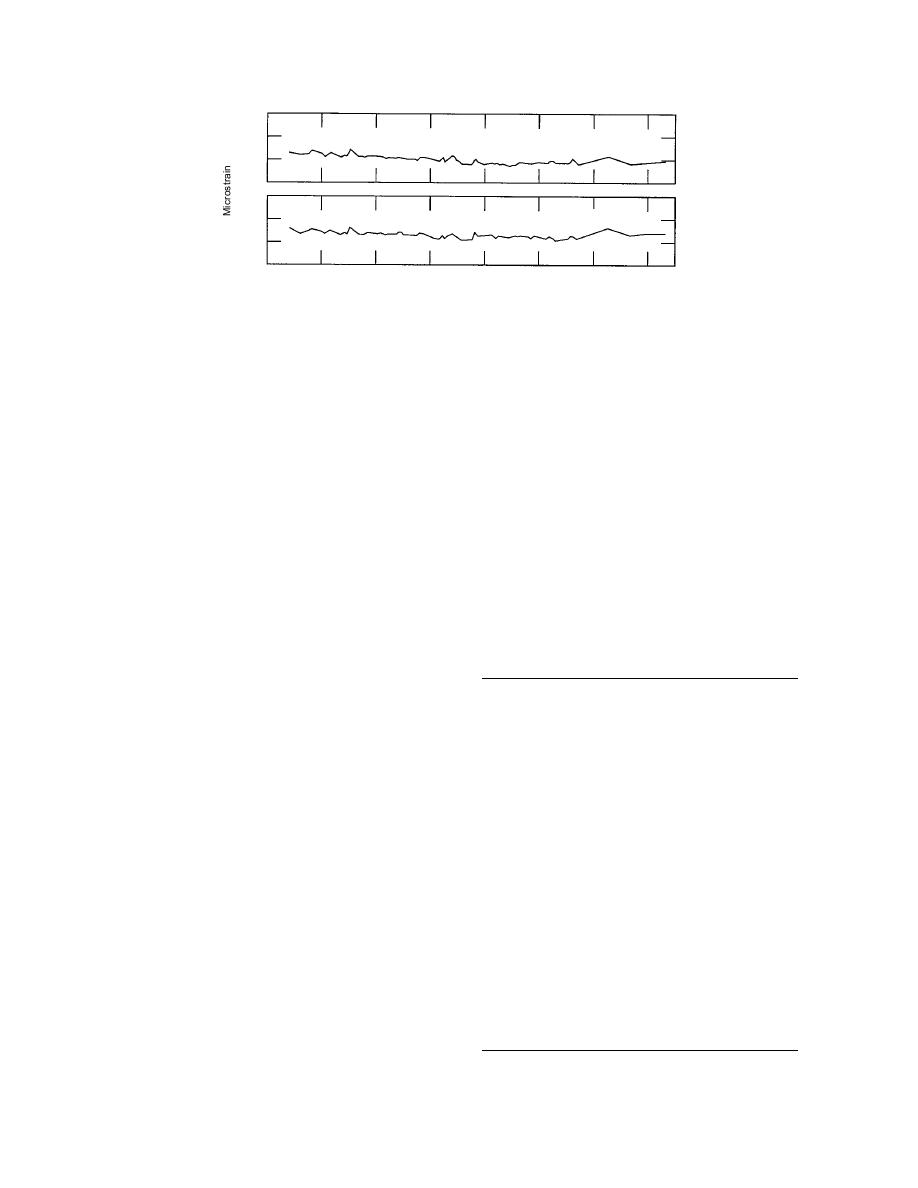
12.70-mm- (0.5-in.-) diam. rebar., and (b) 15.88-mm- (0.625-in.-) diam. rebar.
tively. If any creep occurred, the strain readings
a thermocouple sensor, and a third thermocouple
would continue to increase. However, the results
measured the air temperature of the chamber near
showed that over this period, the strain did not
the specimens. The specimens were again sub-
tend to increase. The temperature variation of the
jected to a long test period, from 25 April to 30
room in which the test fixture was placed caused
September, a total of 3,792 hours (158 days). The
the daily variation of the strain, as seen by the
strain readings taken approximately once a week
zigzag lines of the record, but the general trend
were remarkably steady over this period. The
did not reveal the development of any creep
numerical data recorded for this test are shown
under the test conditions.
in Table 16. Figure 63 gives the plotted data.
Since no creep could be detected at room tem-
perature, we expected no creep to occur at low
temperature (23C, 10F). However, creep might
have resulted if the low temperature induced any
Table 16. FRP rebar creep test data at 49C (120F).
microcracking or degradation of the interface bond
by the induced thermal stresses from the thermal
Chamber temp.
Microstrain*
Microstrain*
(F)
expansion coefficient mismatch between fibers
Date
in rebar no. 5
in rebar no. 6
and matrix. A relatively longer period of test was
04/25/94
120
1209
1281
necessary to develop these effects. Accordingly,
05/02/94
120
1209
1273
the deadweight test fixture was placed in a refrig-
05/09/94
119
1220
1279
erated coldroom, where the temperature was
05/16/94
119
1221
1274
constantly maintained at approximately 10C
05/23/94
120
1216
1273
06/01/94
120
1218
1276
(23F). This test was continued for 3,552 hours
06/07/94
120
1220
1270
(148 days). The strain records of the 12.70-mm (0.5-
06/15/94
119
1222
1276
in.) and 15.88-mm (0.625-in.) rebars are shown in
06/22/94
121
1211
1268
Figures 62a and b, respectively. Again, no discern-
07/01/94
119
1215
1269
07/05/94
121
1220
1272
ible trend of increasing strain was observed.
07/06/94
122
1220
1272
For the high-temperature (120F, 49C) creep
07/07/94
121
1215
1272
test, a special environment chamber of 1.22 1.22
07/15/94
121
1218
1275
2.44 m (4 4 8 ft) was built with a thermo-
07/21/94
118
1213
1273
statically controlled hot-air blowing system that
08/01/94
119
1217
1268
08/08/94
118
1216
1272
would control the temperature of the chamber to
08/15/94
121
1221
1276
between 50C (122F) and 47.2C (117F). At the
08/22/94
121
1223
1277
end of the coldroom test, the strain gages on the
09/01/94
122
1219
1276
15.88-mm (0.625-in.) rebars were damaged and
09/07/94
122
1221
1276
the bars themselves were unsuitable for further
09/15/94
120
1221
1271
09/20/94
121
1221
1271
testing. Accordingly only two 12.70-mm- (0.5-in.-)
09/30/94
118
1216
1262
diam. rebars were tested in the high-temperature
* Microstrain = strain 106
chamber. Each specimen was instrumented with
45


 Previous Page
