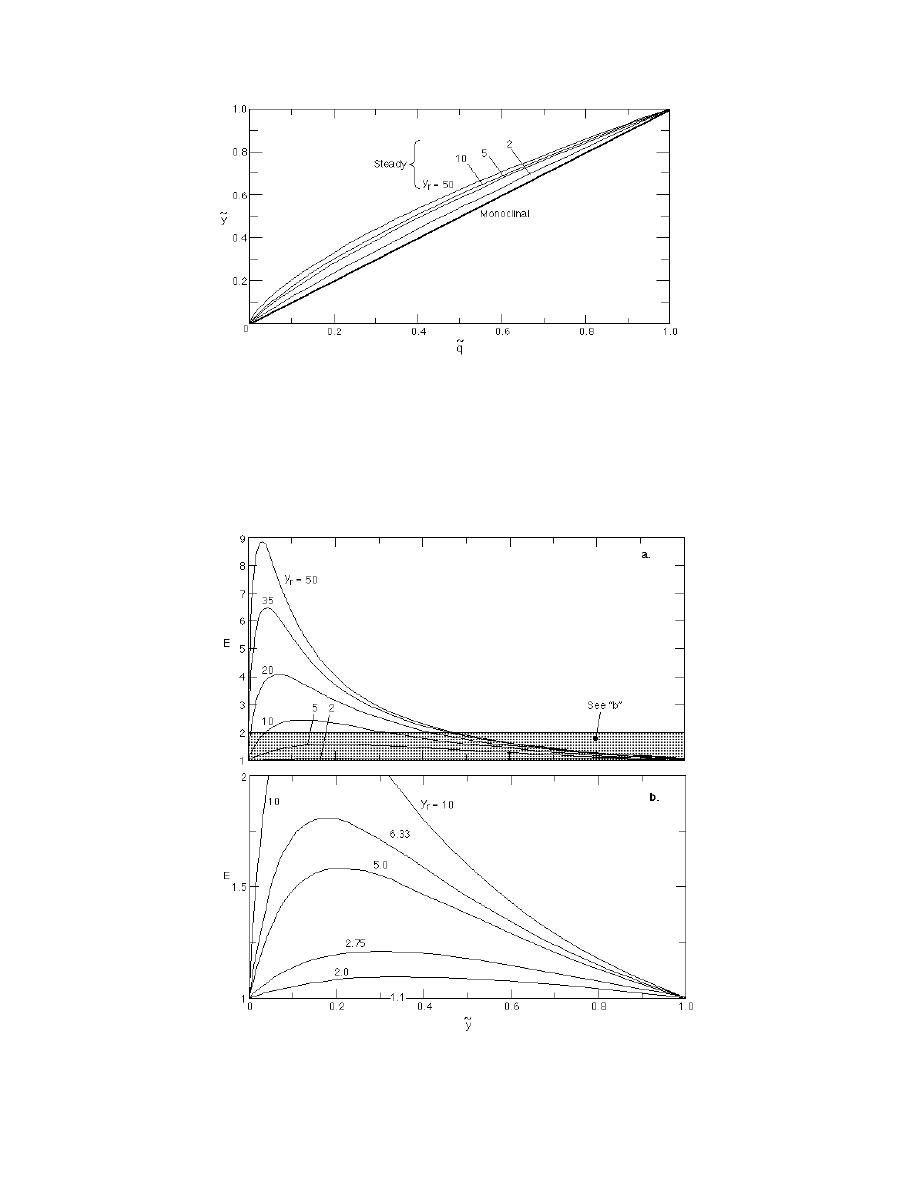
Figure 15. Dimensionless monoclinal and steady state rating curves for
depth ratios ranging between 2 and 50.
Figure 16 gives E as a function of y for selected values of yr. The maximum E increases with
~
yr and moves from near the midpoint of the profile toward the leading edge. Conversely,
Figure 17 gives E as a function of yr for selected values of y . At small yr the largest E is
~
located near the midpoint of the profile. As yr increases E approaches a constant starting at
the midpoint of the profile and progressing toward the leading edge. At large depth ratios
E is inversely proportional to y , increasing toward the leading edge.
~
Figure 16. Energy gradient and Froude number parameter E along the monocli-
nal wave profile for selected depth ratios. Panel b is an expanded view of the shaded
area in panel a.
21


 Previous Page
