less than "fair" accuracy (Novak 1985, p. 65).
Analysis of the distribution of discrepancies (Fig.
9) between published and projected values during
periods of ice effects, computed as
log[z(+) (k)] - log[z(k)]
e(k) =
(19)
log[z(k)]
indicates that the absolute value of elements in the
e sequence are less than 8%, 87.2% of the time and
are less than 15%, 96.6% of the time.
Projections of streamflow are shown with other
streamflow and climatological data for the selected
periods in Appendix A. Upper and lower projec-
tions were computed by adjusting the variance of
Q to 0.0035 so that the interval formed between the
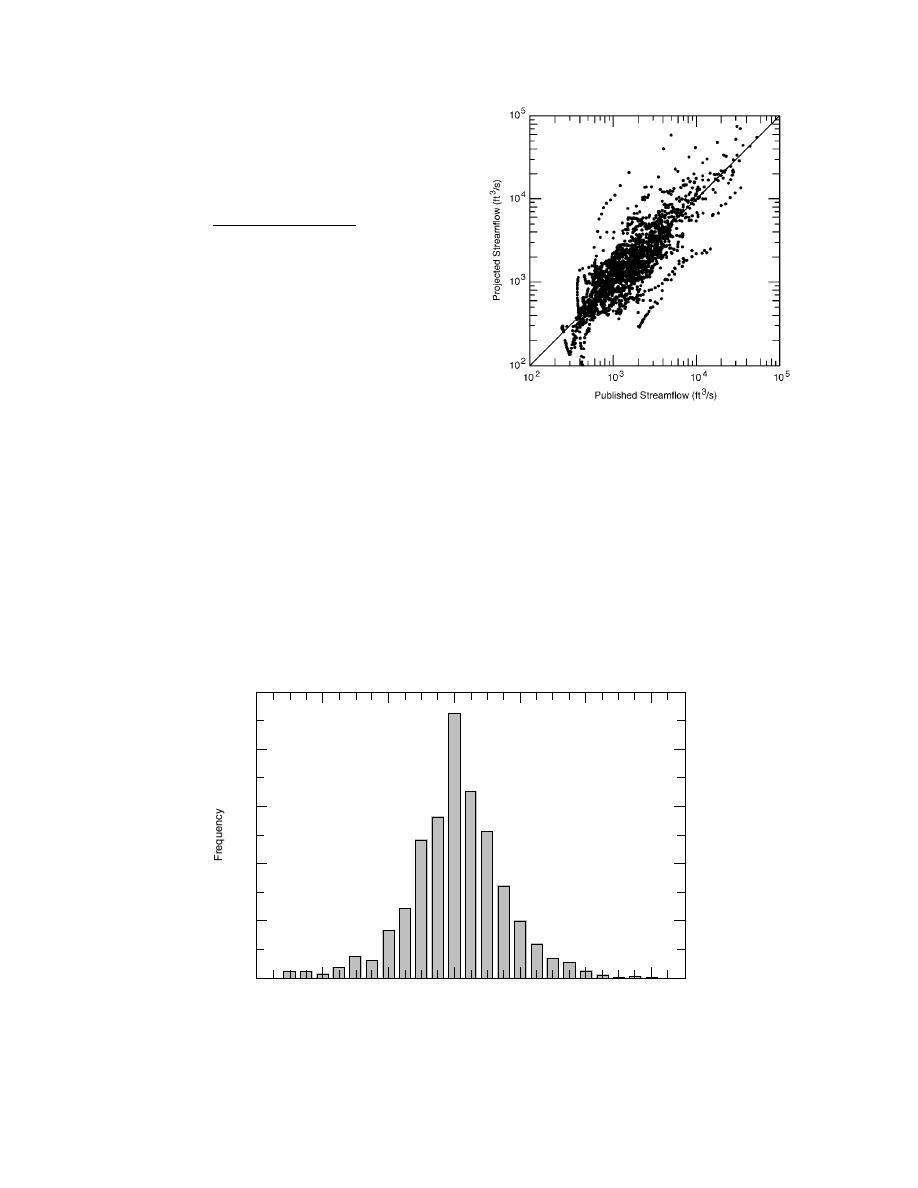
Figure 8. Relationship between published and
upper and lower projections about the temporal
projected streamflow during selected ice-affected
updates at k' contained the published values 90%
periods at St. John River at Dickey, Maine, gage
of the time.
from 1971 through 1993.
Platte River at North Bend, Nebraska
The protocol developed for the St. John River was followed when the extended Kalman filter
was applied to Platte River data. This was done by manually adjusting preliminary estimates of
threshold parameters to minimize the sum of squared errors in the temporal updates of the stream-
flow ratio for days of direct measurement. Again, once apparently satisfactory estimates of the
threshold parameters were obtained, they were fixed (Table 2) and the filter was run until conver-
gence. In this process, initial estimates of the state error covariance matrix converged from an initial
diagonal matrix with nonzero elements of [0.5 0.5 0.01 10] to a covariance matrix with standard
errors shown in Table 2.
500
400
300
200
100
0
0.3
0.2
0.1
0
0.1
0.2
0.3
Discrepancy Between Logarithms of Published and Projected Streamflow
Figure 9. Distribution of discrepancies between logarithms of published and pro-
jected streamflow during selected ice-affected periods at St. John River at Dickey,
Maine, gage from 1971 through 1993 (logarithms are in base 10).
12


 Previous Page
