is higher than the mode class of the distribution of empirical streamflow ratios (Fig. 2), it is physi-
cally realizable. Similarly, x5 is consistent with the distribution of air temperatures during periods
of ice effects and the physical conceptualization of the process (Fig. 3). However, analysis of the
state error covariance matrix points to a large positive correlation (>0.99) between x2 and x5 and a
large negative correlation (< 0.93) between x3 and x4. Thus, although the form of the difference
equation used to describe mode 1 dynamics resulted in parameters with physically realizable val-
ues, the large correlations indicate ambiguity concerning their true values. Because of the high
correlations in the state error covariance matrix, there is a potential for reducing the dimension of
the state parameter vector without loss of filter accuracy.
Sensitivities for threshold parameters (Table 1) were estimated as the change in the sum of
squared errors in the streamflow ratio divided by the change in the corresponding parameter near
the selected values. Results of simulations show that filter computations were most sensitive to
changes in the q_dl parameter and least sensitive to the t_lo parameter. Formal optimization of the
threshold parameters could lead to further improvement in filter performance.
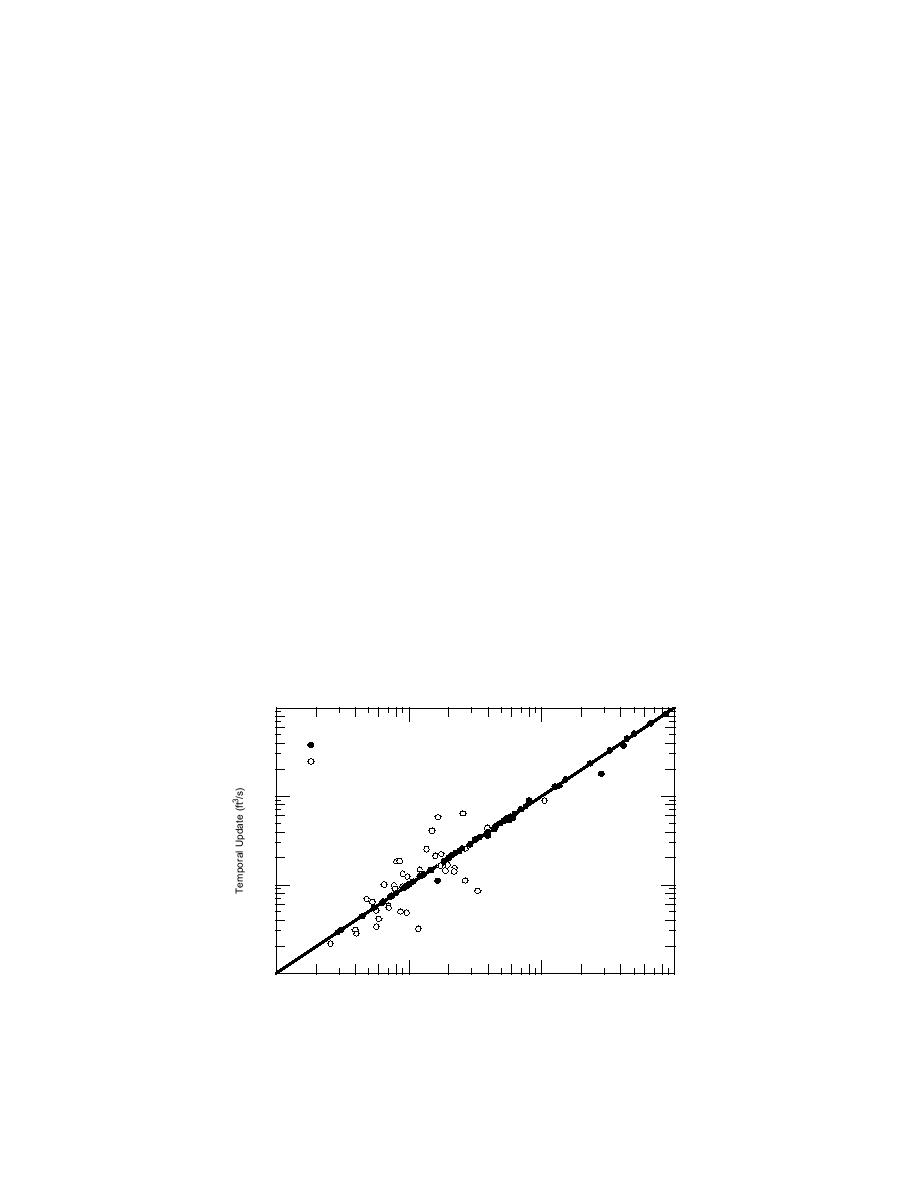
One measure of the projection accuracy of the filter is the relation between temporal updates of
streamflow z1-) (k ′) and published daily values z(k′), where k′ indexes days of direct measurement
(
(Fig. 7). Although this value is modified by observational updates to more precisely project stream-
flow on days of direct measurement, z1-) (k ′) provides a conservative indication of the filter accu-
(
racy. The temporal update is a conservative sign of accuracy because the variance of the projection
increases monotonically with time from the previous measurement, and the length of the projection
is at maximum just before the observational update. Results for the St. John River show that the
(-)
correlation between log-transformed values of z1 (k ′) and z(k′), based on 40 days of ice-affected
measurements, is 0.777 and is 0.998 based on 63 days of open-water measurements. Measurements
at the St. John River used in this analysis averaged 8.6 weeks apart.
Another measure of filter accuracy is the relationship between published and projected stream-
flows during periods of ice effects. This relation is linear in the logarithm of transformed values
(Fig. 8). Uncertainty occurs in both the published and projected values. Published values during ice
effects are subjectively rated "fair" or "poor." A rating of "fair" implies that about 95% of the daily
values are within 15% of the true value; a "poor" rating means that daily streamflow values have
105
Open-water Measurement
Ice-affected Measurement
104
103
102
102
103
104
105
Published Streamflow (ft3/s)
Figure 7. Relationship between published streamflow and temporal updates
of streamflow on selected days of direct measurement at St. John River at
Dickey, Maine, gage from 1971 through 1993.
11


 Previous Page
