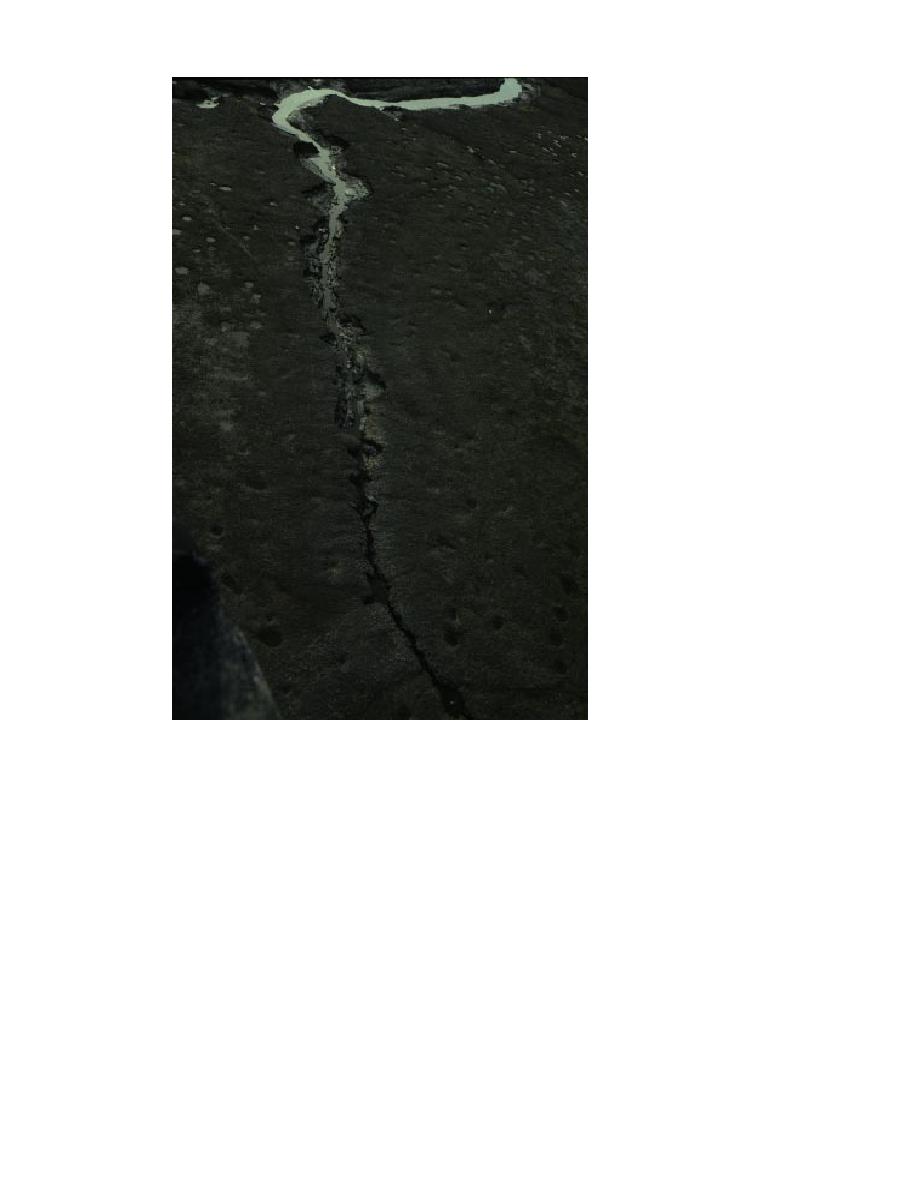
b. B-Gully.
Figure 27 (cont'd).
16, 23a and c). Bread Truck Gully (Fig. 28 and
Parachute Gully on the west side of Area C (Fig.
23a) was first monitored in 1993 when headward
16). Since monitoring began in 1992, Parachute
Gully (Fig. 23b and 26) has undergone up to 12.1
recession ranged from 0.3 to 5.0 m and lateral
recession was on the order of 0.2 to 2.2 m (Table
m of headwall recession but only 1.8 m of lateral
recession (Table 8). Recession has centered around
8a). In 1995, headward recession accelerated to
a drainageway that has become incised and en-
11.7 m during the May 1995 flooding tide (rep-
larged where multiple craters were once situated.
resenting the winter 9495 erosion column of
In this situation, the craters became hydraulically
Table 8a) and an additional 20 m during the
1995 summer season. These rates do not appear
connected by localized scour during ebb; the di-
to be exceptional or unique; Coastal 5 Gully
rection of gully extension is dictated by their pres-
receded by 17 m during the summer of 1995
ence. There was similar enhanced erosion along
and a total of about 26 m since the hub and line
drainageways in Area A (Fig. 27a) and B-Gully
stakes were established in July of 1994.
(Fig. 27b).
Recession at the B-gully site, monitored since
Bread Truck and Coastal 5 gullies bracket the
mouth of the Eagle River and are the sites with
1992, is the result of lateral erosion. The moni-
the maximum rates of headward recession (Fig.
tored section lies along the margin of a peninsula
37


 Previous Page
