strength of the model ice to a prescribed value
ARCTEC Inc. developed and patented a process
commensurate with the model scale. The other is
for rapidly producing ice sheets. In specially de-
to produce an ice sheet whose crystal structure is
signed tank facilities, the air was cooled to about
60C by spraying liquid nitrogen over the surface
amenable to weakening. Therefore, crystal struc-
ture, additives, and warming are the three main
of the tank of saline (NaCl) water. The ice was
methods used to prepare a weakened ice to suit a
grown at rates up to 10 mm/hour. At this rapid
particular modeling situation. Considerable skill is
growth rate, a large amount of brine was trapped
necessary to combine the ingredients and prepare
in the ice, resulting in low ice strengths. ARCTEC
the model ice. The IAHR Working Group on Ice
built two facilities around this process and tested
Modeling Materials (IAHR 1992) gives an excellent
mainly icebreaker models between 1970 and 1987,
history of the advances in preparing weakened ice.
even though the process became expensive due to
Doped ice. Chemically, or solute, weakened ice is
the increasing cost of the liquid nitrogen. Urea
often called doped ice. A chemical, or dopant, is
dopant was substituted for the NaCl in the later
added to the water before freezing and ice sheet
years. No strength data are publicly available for
growth. Sometimes several chemicals are added,
ARCTEC's ice.
and they are known collectively as the dopant. An
Timco (1980) reported producing 40-mm-thick
incubation process usually is needed to start the ice
ice sheets, grown from a 1.3% carbamide (urea)
solution, with an E/σf ratio of 2400 for flexural
sheet so that it forms the required crystal structure.
While the ice sheet thickens, the dopant is rejected
strengths as low as 20 kPa. However, Hirayama
and trapped in "brine" pockets between the ice
(1983) reported that, for 20- to 25-mm-thick ice, the
E/σf ratio could be on the order of 1000 or less. The
crystals, giving the sheet a structure similar to that
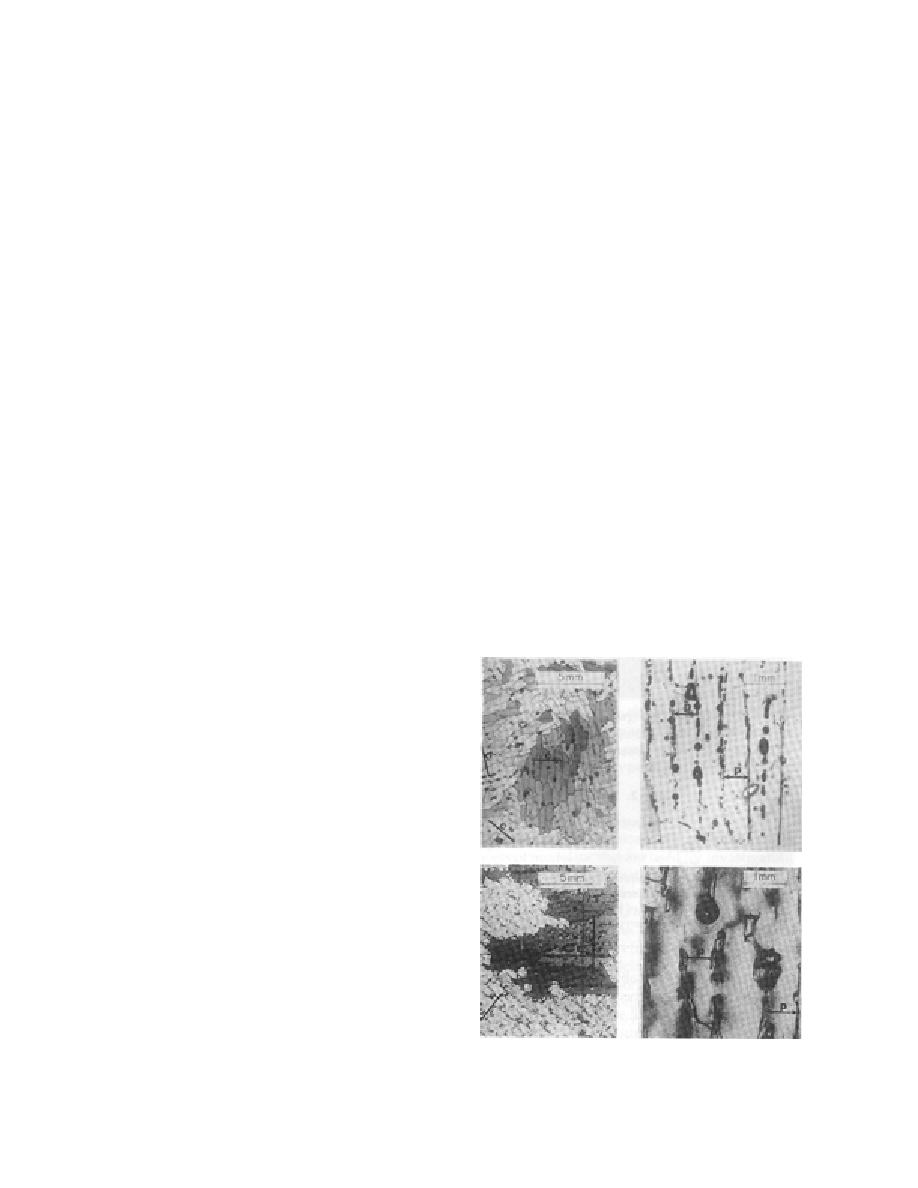
carbamide-doped ice was very similar in structure
of sea ice. The presence of these pockets reduces
to the saline ice (Fig. 9), due to the growing proce-
the initial strength of the model ice as compared
dure (Gow 1984). For both ice types, the water sur-
with that of freshwater ice. Strength properties can
face is seeded with a fine mist, resulting in a fine
be further reduced by warming the sheet, which
requires raising the air temperature above the
crystalline pattern on the surface. The ice cover
sheet close to the freezing point of the solution
then grows thermally with vertical, columnar
from which the sheet is made, thereby tempering
crystals extending down into the water. The re-
the ice sheet. During tempering, the brine pockets
sulting ice could be considered to be two-layered:
enlarge and weaken the ice. During tempering,
a strong congelation upper layer over a weaker
which may take hours, the sheet's modulus of elas-
ticity E decreases faster than its flexural strength σf,
so that the ratio E/σf also decreases. The common
practice is to limit the geometric scale for ice-load
modeling with doped ice in accordance with the
minimum ice strength that can be attained while
ensuring that E/σf remains above about 2000. This
limit is a subject of debate among ice modelers.
Doped ice was developed originally for model-
ing ice forces on structures and icebreaker vessels.
The earliest doped model ice was grown from a 2%
saline solution. For workable length scales of 25 to
40, the saline ice gave E/σf ratios much lower than
1000, below the minimum acceptable value of 2000
for sea ice. Schwarz (1977) emphasized the impor-
tance of maintaining a high E/σf ratio and used a
lower concentration (0.6%) saline solution to grow
model ice. However, even with tempering, the
minimum flexural ice strength achievable was on
the order of 60 kPa, significantly greater than that
required for a geometric scale of 25 and above. The
model test results, therefore, had to be corrected or
extrapolated to the proper ice strength, which add-
ed another possibility of error and uncertainty in
Figure 9. Comparison of size of crystals and brine
the final test predictions.
pockets in urea-doped ice (top) and sea ice (bottom).
12


 Previous Page
