300
200
Arithmetic
Error
100
Geometric
Error (abs.)
0
3
2
1
0
10
10
10
10
Approach Factor
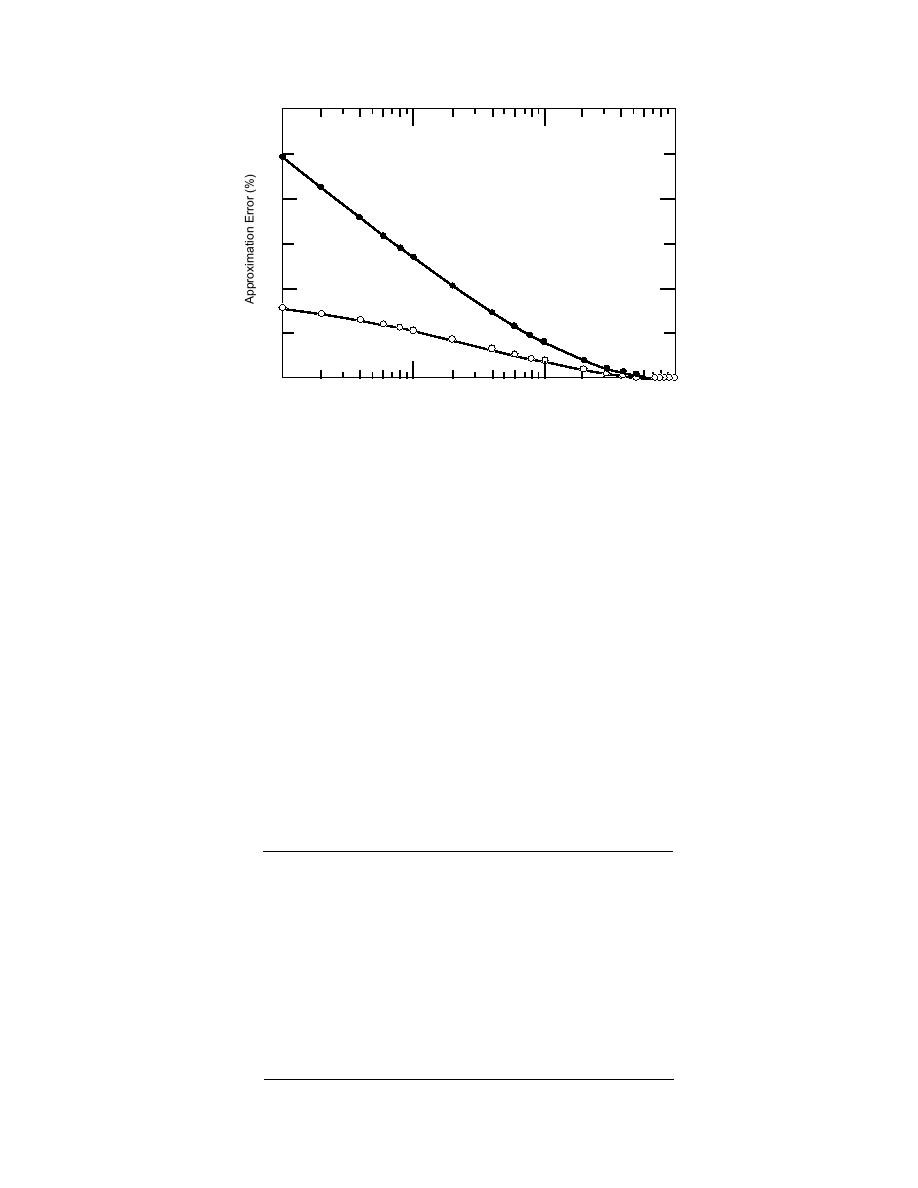
Figure 4. Errors from approximating the logarithmic mean temperature differ-
ence with arithmetic and geometric mean temperature differences.
logarithmic mean temperature difference is always negative. Thus, the predicted
heat transfer using this approximation would always be conservative; i.e., it would
under-predict the actual heat transfer. We also note from Table 2 that, as we had
shown analytically, the error resulting from the use of the geometric mean approxi-
mation approaches 100% in magnitude as AF goes to zero and approaches zero as
AF approaches unity.
The ratio of the error from using the arithmetic mean and geometric mean
approximations is also given in Table 2. Because the error from the arithmetic mean
approximation becomes infinite and the error from the geometric mean approxima-
tion approaches 100% as the approach factor AF goes to zero, their ratio approaches
zero at that point. Thus, the geometric mean approximation is infinitely better than
the arithmetic mean approximation at that point. Since neither approximation is
acceptable near that point, this observation is of little use. However, it is of interest
to note that the ratio of errors approaches 1/2 as AF approaches unity. Although this
Table 2. Errors from approximating the logarithmic mean
temperature difference.
Approach
Arithmetic
Geometric
Ratio of
factor
mean error
mean error
errors
εa(%)
εg(%)
εg/εa
AF
+∞
0.0
100.0
0.00
0.0001
361.0
90.8
0.25
0.001
246.0
78.1
0.32
0.01
135.0
53.4
0.40
0.1
40.7
19.1
0.47
0.2
20.7
10.0
0.48
0.3
11.8
5.79
0.49
0.4
6.90
3.41
0.495
0.5
3.97
1.97
0.497
0.6
2.17
1.08
0.498
0.7
1.058
0.528
0.4992
0.8
0.415
0.207
0.4997
0.9
0.0925
0.0462
0.4999
→ 0.500...
1.0
0.0
0.0
22


 Previous Page
