1.0
0.8
0.6
m/md
0.4
0.2
0
2190
4380
6570
8760
t (hr)
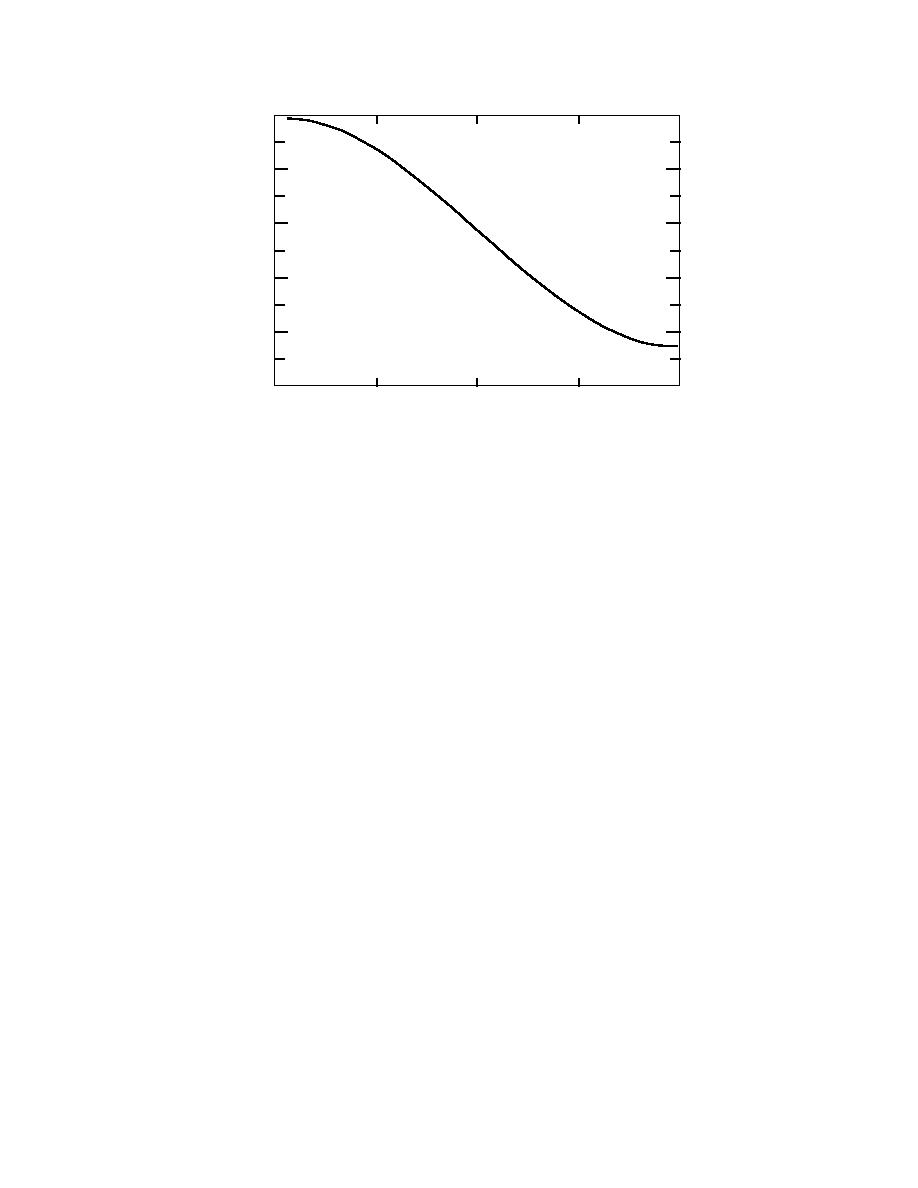
Figure 2. Load duration curve.
28 is an even function about its midpoint of 8760/2 = 4380 hours, the number of hours
for which the load will exceed any given level is simply twice the number of hours
from the time of maximum load (t = 0) until the time that load would have occurred.
This yields an equation of the same form as eq 2-28, except that the period of the
function is now twice as long, i.e.,
m / md = [0.425 cos(2πt/17,520) + 0.575].
˙ ˙
(2-29)
The form of the resulting load duration curve is shown as Figure 2. This result is
similar to the shape of empirical load curves determined by other investigators, such
as Werner (1984), except that it over-predicts the number of hours at which high
loads occur. Since this will result in a conservative design, this is a suitable
approximation for design purposes. The equivalent full load utilization time is
another factor used to evaluate the load in district heating systems. The equivalent
full load utilization time is the amount of time at which the load would have to be
at its maximum value to result in the total heat supplied being equal to that supplied
over the actual yearly cycle. This time can be easily found by integrating eq 2-28 over
the yearly cycle
8760
∫
tu =
(0.425 cos (2π t/8760) + 0.575) d t
(2-30)
0
yields a value of tu = 5037 hours. This value is near the upper end of the range of
measured values reported by Bhm (1988) for a number of Danish district heating
systems.
A number of other technical parameters need to have values assigned to them for
us to proceed with this sample calculation. The following values selected are felt to
be well within the range of what could reasonably be expected in an actual design:
Aη = 0.90 (dimensionless)
Tm = 6.4C
ki = 0.030 W/m C
14


 Previous Page
