Technical assumptions
The major technical assumptions that we make are related to the heat load
characteristics and the method by which the heat load is met. In district heating
systems, the amount of heat supplied can be varied to accommodate varying
demand by adjusting either the supply temperature or flow rate. However, certain
constraints imposed by consumer equipment and minimum temperature re-
quirements must be observed. In larger systems, both the supply temperature and
flow rate are varied over the course of the year. In small systems, which must adopt
simpler control strategies, often only the flow rate is varied. For the sake of
simplicity, we assume the latter here and assume that the supply and return
temperatures remain fixed over the yearly cycle. This is never actually the case, but
for system design, it is felt that this is an appropriate simplifying assumption for a
first analysis. Ideally, for example, the supply temperature, return temperature and
flow rate at the consumer would be determined by the heat transfer characteristics
of his heat exchanger under the prevailing load. A model that simulates the
consumer's heat exchanger is developed in Chapter 3, but here it is not considered.
The actual heat load in district heating systems has several major components. A
detailed treatment of the heat load would be difficult and is not warranted for design
purposes. For an excellent treatment of the actual heat loads in operating district
heating systems, see Werner (1984). The assumption we make here for design
purposes, that the heat load can be approximated as sinusoidal, is supported by the
data presented by Werner (1984) as well as by the data of Phetteplace et al. (1981).
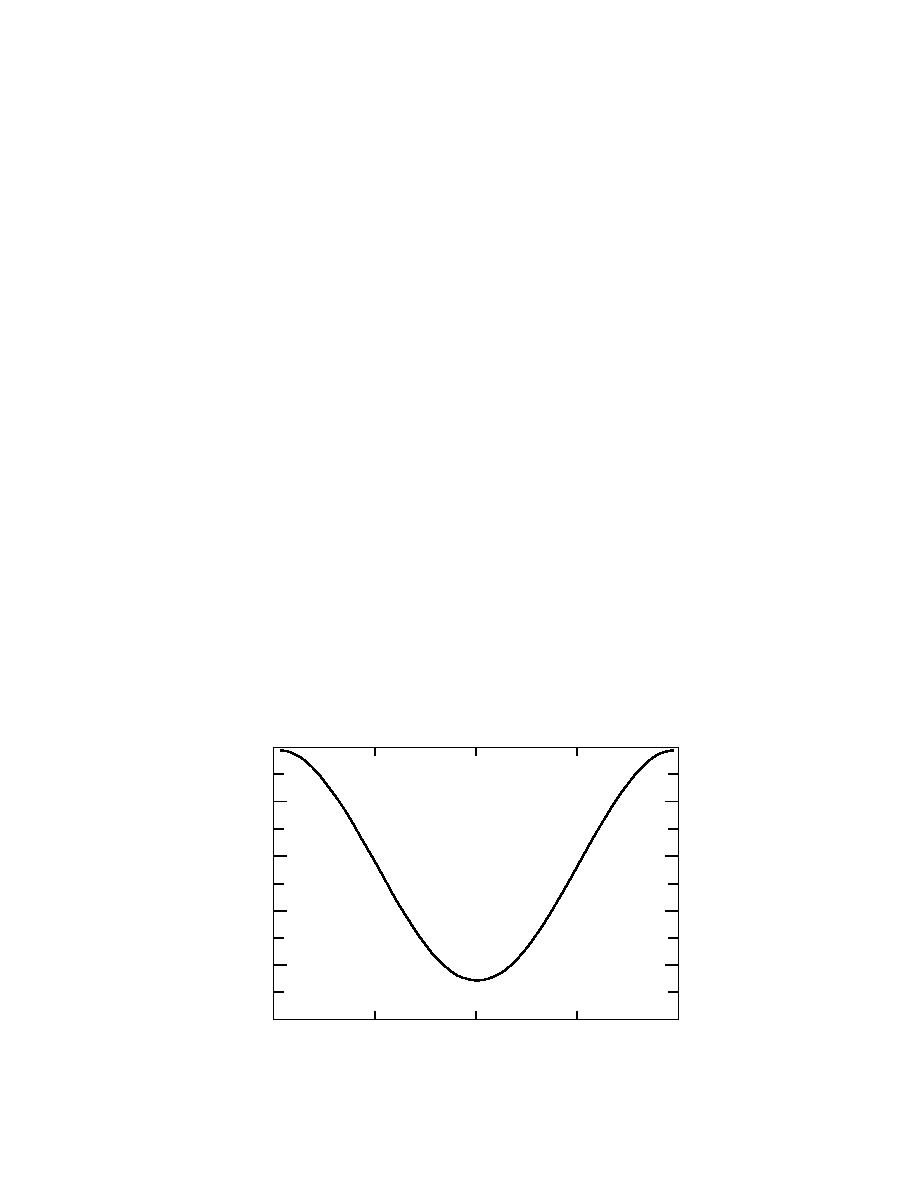
We assume here that the heat load varies sinusoidally from a minimum of 15% of its
maximum value to its maximum value. The assumed minimum load of 15% would
result primarily from hot tap water use and heat losses from the pipelines. Thus,
with our assumption of constant supply and return temperatures, the mass flow rate
as a function of time is
m / md = 0.575 + [0.425 cos(2πt/8760)].
˙ ˙
(2-28)
The ratio of the mass flow rate to its maximum value as determined by eq 2-28 is
shown in Figure 1. With this simple function for the load curve, it is easy to determine
the shape of what is normally referred to as the "load duration curve." Since eq 2-
1.0
0.8
0.6
m/md
0.4
0.2
0
2190
4380
6570
8760
t (hr)
Figure 1. Assumed annual load curve.
13


 Previous Page
