30 ≤ Φ ≤ 160, the differences were only 23%.
CDN10 values for head-on flow are in a reasonable
range, 1.361.51 103.
Consequently, the choice of CS10 does not have a
Figure 4b investigates the sensitivity of the
big effect on the results, as long as the value is a
model to γ when h = 10 cm. For this value of h,
reasonable one. Secondly, my handling of the dis-
γ = 0.10 yields CDN10 values for head-on flow of
placement height in converting from CS10 to CSh is
1.36 103. Although we did measure four CDN10
appropriate, given this weak sensitivity to CS10.
values in this range, the more likely lower limit is
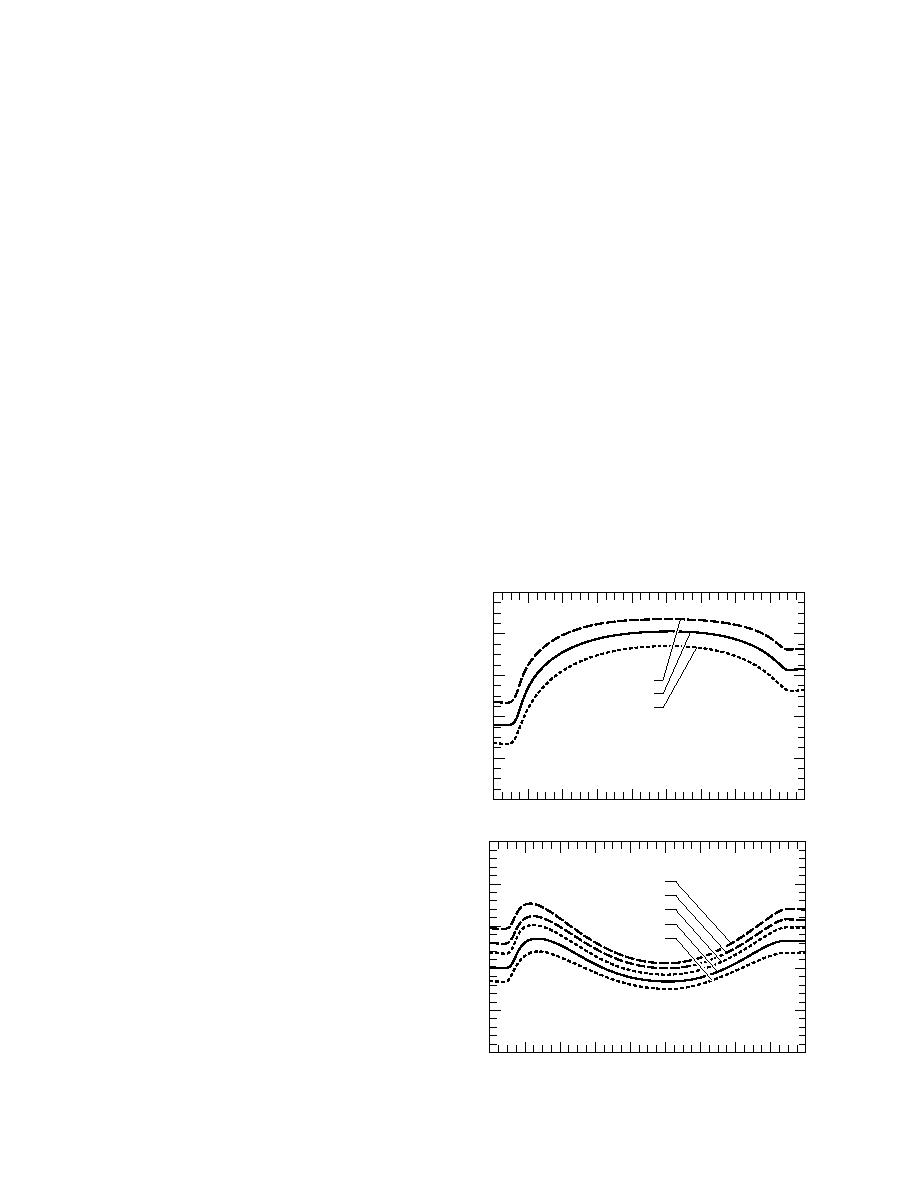
Figure 5 shows some examples of how the
about 1.5 103. Also, as Φ increases, the predict-
stress is partitioned between form drag and skin
ed CDN10 values reach a maximum that is 6% be-
low our observed maximum. When γ is 0.20 and
figure, the (γ = 0.10, h = 10 cm) and the (γ = 0.20,
0.25, the predicted head-on values for CDN10 are
h = 20 cm) lines, respectively, show the minimum
roughly correct, 1.501.55 103. But for these γ
and maximum values of τR/τ that I obtained for
values, the maximum predicted values are, re-
the range of model parameters considered. My
spectively, 17 and 26% above our observed maxi-
computations suggest that, even for a very rough
mum. Notice, γ = 0.25 means that the sastrugi
surface, γ = 0.20 and h = 20 cm, skin friction pro-
cover half the area that they would if they were
duces more than half of the total stress when the
packed as tightly as possible. This value is, there-
flow is approximately head-on. In other words,
fore, probably an unrealistically large sastrugi
the streamlined shape of the sastrugi is quite ef-
coverage for ISW.
fective at reducing form drag. When the flow is at
For the γ = 0.15 and h = 10 cm case--the one
right angles to the sastrugi, however, form drag
that fits the data best--I also ran the model with
dominates the total stress because the wind has
CS10 = 1.00 103 (not shown), roughly the small-
so much more surface to push against. This dom-
est value compatible with the surveys I cited ear-
inance of form drag for such wind orientations
lier. Resulting predictions for CDN10 were 46%
explains why the drifts erode so quickly (AC95).
lower for 0 ≤ Φ ≤ 20 and for 160 ≤ Φ ≤ 180 than
Equation 46 yields the displacement height;
for calculations based on CS10 = 1.10 103. For
Figure 6 shows several computations of d/h. For
1.0
0.8
0.6
(γ, h) = (0.20, 20)
τR
(0.15, 10)
τ
(0.10, 10)
0.4
Figure 5. Stress partitioning, τR/τ, versus the mean
0.2
wind direction with respect to the dominant axis of
the sastrugi. Realize that τS/τ = 1τR/τ. Here, γ is the
0
fractional sastrugi coverage, and h is the sastrugi height
0
20
40
60
80
100
120
140
160
180
Wind Direction, Φ ()
in centimeters.
0.5
(γ, h) = (0.20, 20)
0.4
(0.20, 10)
(0.15, 20)
(0.15, 10)
0.3
(0.15, 5)
d
h
0.2
0.1
Figure 6. Computed displacement height d scaled by
sastrugi height h versus the direction of the mean
wind with respect to the sastrugi. Here, γ is the frac-
0
0
20
40
60
80
100
120
140
160
180
Wind Direction, Φ ()
tional sastrugi coverage, and h is in centimeters.
9


 Previous Page
