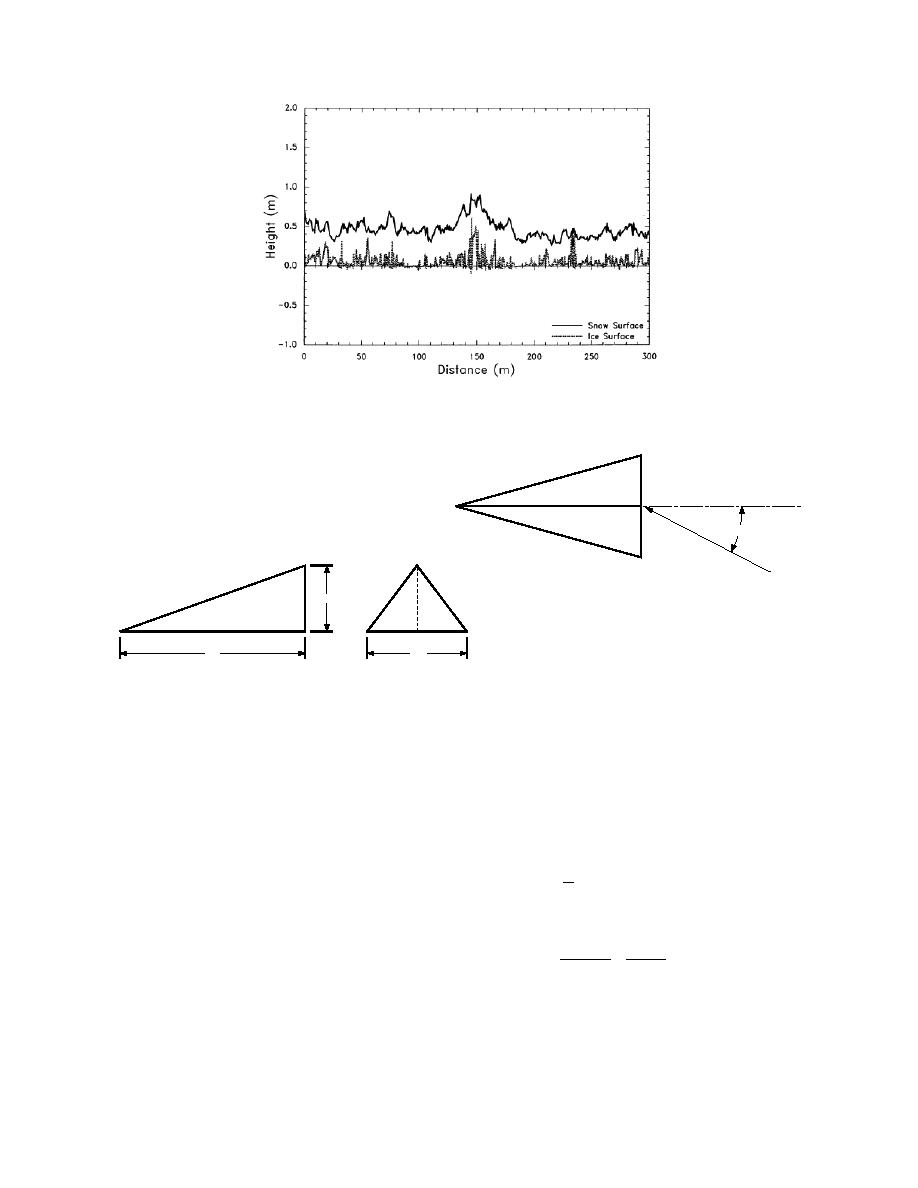
Figure 2. Snow and ice surface elevations near our ISW profile
tower on Julian day 78 (in 1992). The sampling interval was 0.5 m.
The profiling line is not necessarily aligned with the mean wind.
Top
β
β
Φ
Front
Side
Wind
h
nh
mh
Figure 3. Geometry of the sastrugi-like snowdrifts being modeled here.
height h, width mh, and length nh. The angle Φ
per unit ground area. Suppose the fraction of the
area covered by the sastrugi-like roughness ele-
describes how the mean wind is oriented with
ments is γ. Thus, from Figure 3, the unit area repre-
respect to the sastrugi. When the wind has been
sented by each roughness element is mnh2/2γ. The
blowing with constant direction at speeds of
68 m/s, or higher, for several hours, Φ will be
base length of the triangular frontal area that each
roughness element presents to the wind, L(Φ), is a
zero.
function of Φ. Likewise, the silhouette area pre-
From the discussion in the penultimate para-
sented, A(Φ), is simply
graph, we see that h is 520 cm. Descriptions of
drifted snow in the literature (Finney 1939, Mel-
1
A(Φ) =
hL(Φ).
lor 1965, Jackson and Carroll 1978) and Plate's
(4)
2
(1971, Figure 4.17) pressure distribution around
Consequently, λ is also a function of Φ
roughness elements similar to that in Figure 3
suggest that n is about 10. From Mellor's (1965)
2γA(Φ)
γL(Φ)
description of sastrugi, I assume that m is about
λ(Φ) =
=
.
(5)
mnh2
4. Notice, these parameters imply that, in Figure
mnh
3
In Figure 3, we see that there are four Φ regions
β = arctan(m/2n) = 11.3.
for which a roughness element presents different
(3)
faces to the wind for 0 ≤ Φ ≤ 180 (symmetric for
0 ≥ Φ ≥ 180). These and the associated values of
One of the key parameters in R92's model is λ,
L, A and λ follow.
the frontal area of a typical roughness element
3


 Previous Page
