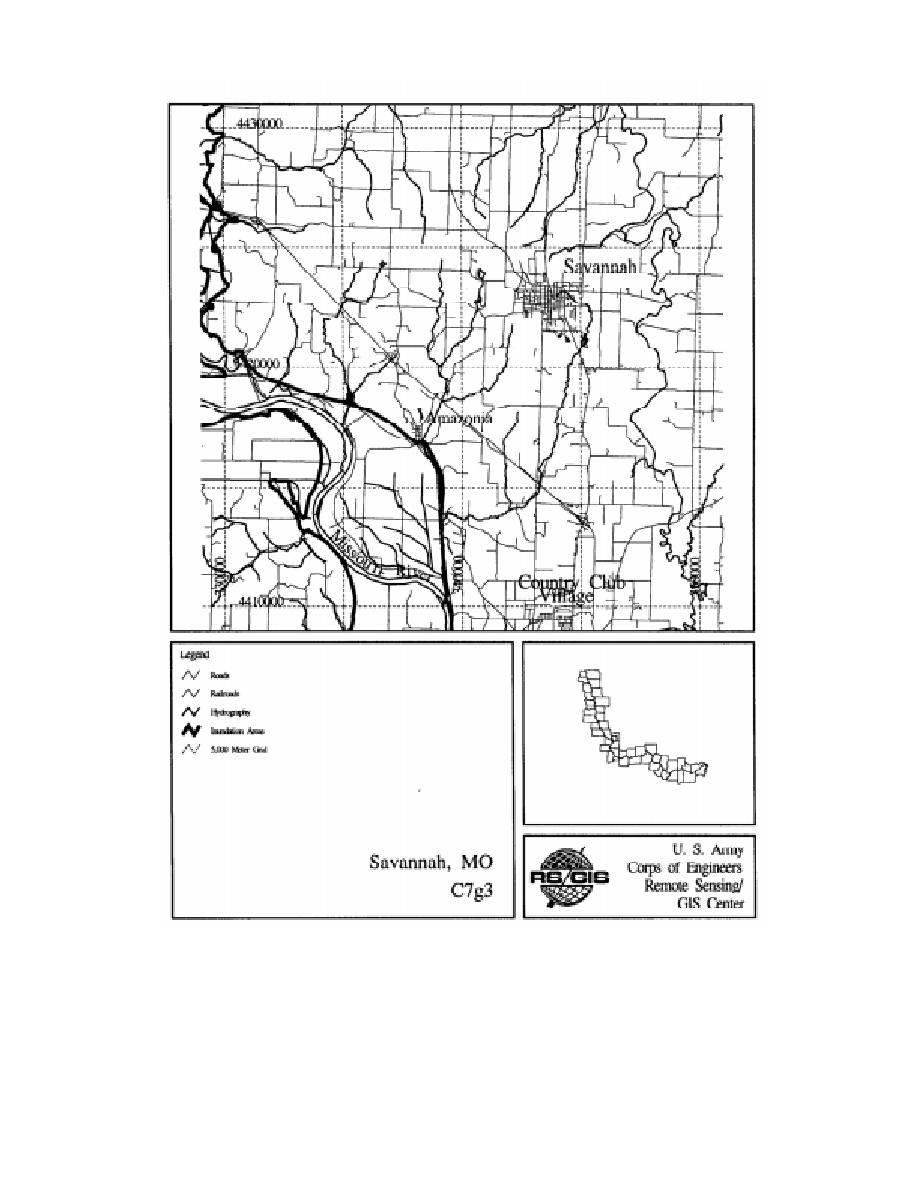
Figure 5. The 20,000- 20,000-m map for index box C7g3, Missouri River, showing roads, railroads,
hydrography, and 5000-m grid. The projection is UTM zone 15.
The annotation for each map included UTM coordi-
notation by pointing and clicking on the map on
nates for the 5000-m grid, and city and river names.
the computer screen.
The AML program allows the map producer to
zoom into each 100,000- 100,000-m and 20,000-
Mississippi River
20,000-m region directly by selecting the region
The first set of maps was produced for the Mis-
from the menu. The AML also has tools to allow an-
sissippi River. The reach of river covered in the
10


 Previous Page
